Fixed Income Market Summary – May 2019
US Treasuries – Trade war fears dominated the headlines in May, and equity market volatility re-emerged. This was good news for Treasuries which posted a strong month. Yields declined across the curve, with the 10-year yield reaching a 2019 low of 2.12% at the end of the month. Federal Reserve Chairman Powell indicated that the committee would consider a rate cut if equity markets continued to sour on trade news. The Treasury yield curve flattened slightly in May and inversion fears persist, but an accommodative Fed may provide relief.
Municipals – Municipals showed no signs of slowing down in May, continuing their impressive, methodical run over the last several months. Municipals yields declined across the curve, yet Municipal yield ratios versus equivalent Treasuries rose slightly, providing a relief in a market that was historically expensive. Seasonal supply is expected to pick up in the summer months as cities look to take advantage of low interest rates, and this supply should be met with considerable demand.
Corporates – Investment grade corporates kept up strong performance and posted another monthly gain in May. Widening credit spreads during the month were no hindrance for corporates, which is now the leading domestic fixed income sector in 2019. Large institutions continue to look to the corporate market for signs of economic weakness.
——————————————————————————————————————–
BOND MARKET PERFORMANCE SNAPSHOT:

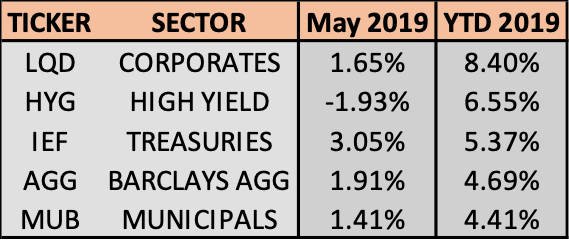
All investment grade sectors outperformed the S&P 500 over the prior 12 months, and an accommodative Fed should continue to support most types of fixed income. Investment grade bonds were the leaders in May, as the S&P 500 dropped over 6% and investors flocked to safety. For the month, Treasuries were the greatest beneficiary, gaining 3% as measured by IEF. For the year, corporates are now the best performing sector in 2019, eclipsing high yield bonds, which are typically more correlated to equities and struggled in May. Municipal bonds netted positive returns in each of the last 7 months but have generated the lowest returns of any sector this year.
TREASURY MARKET OVERVIEW
TREASURY YIELD SUMMARY:

Treasuries delivered strong returns in May as the greatest beneficiary of the negative headlines in the equity markets. The 10-year Treasury yield dove from 2.5% to 2.12%, the largest monthly decline since January 2015. The benchmark yield has now dropped 0.55% in 2019, to its lowest level since September 2017.
The S&P 500 dropped 6.4% in May, as adverse trade news and volatility re-emerged, leading to whispers of a potential rate cut from the Fed. All of this occurred while the US added 263,000 jobs in April and the unemployment rate reached 3.6%, the lowest level since 1969. However, this strong economic data was outweighed by the headline news and led to a notable rotation into safe-haven assets.
The Federal Reserve met in May and kept the benchmark Federal Funds rate constant at 2.25%-2.5%. The committee continues to be concerned about the global growth outlook, specifically in the Eurozone, as the effects of the Brexit separation remain unknown. Despite continued pressure from the President to cut rates, no immediate action is expected at the meeting in June. However, the interest rate futures market is now expecting at least 1 rate cut by the end of 2019, with the current probability at 95%. Continued weakness in the equity market could lead to more than 1 cut, but we will wait to see when the first potential rate cut materializes.
The Treasury yield curve flattened slightly during May, continuing the trend from the first quarter of 2019. The 2-10 spread narrowed to 0.20%, right about where it started this year. A significant drop in yields occurred across the Treasury curve, including the short-end, as the potential rate cut was finally felt by the benchmark 2-year yield, which dropped 0.34%.
The 1-year Treasury yield remains higher than 2 and 5-year yields, reflecting a persistent and continued near-term uncertainty for the US economy. Another sign that the growth outlook remains tepid is the 30-year Treasury yield, which closed well below 3% and sits at 2.57%, its lowest level since October 2016.
——————————————————————————————————————–
MUNICIPAL MARKET OVERVIEW:
TAX-EXEMPT MUNICIPAL YIELD SUMMARY:

TAX-EXEMPT MUNICIPAL YIELDS AS A PERCENTAGE OF TREASURY:

Municipal bonds gained for the 7th consecutive month, the only domestic fixed income sector that can make that claim. Municipal yields across the curve declined and prices rose, as they were also the beneficiary of investors seeking a safe-haven during May. The sector delivered strong performance, but trailed Treasuries and relative valuation ratios continued to ease off historic highs. The 10-year AAA Municipal benchmark yield closed the month at 1.66%, the lowest level since October 2016.
Municipals continued their best start this decade, boosted by continued strong demand. According to the Investment Company Institute, municipal bond mutual funds continued their streak of positive inflows during May, extending the streak to 21 consecutive weeks, the longest since 2016.
An anticipated pick up in supply during June could potentially provide relief from stretched valuations for the municipal market. Many municipalities are ending fiscal years in June and wrapping up their budgets, so seasonality certainly comes into play. Per Bloomberg, the 30-day visible supply for June is about $14 billion, the busiest calendar since October. This metric typically captures about half of actual issuance but still indicates a notable increase in issuance in June versus the first 5 months of the year. Issuance may have been additionally boosted by declining rates, which make it cheaper for local and state governments to issue bonds. This expected increase in supply could loosen up the municipal market, at least temporarily.
For now, Municipal bonds continue to be expensive when looking at yields versus equivalent Treasuries, although ratios improved in May. Specifically, the 10-year municipal yield rose to 78% of the 10-year Treasury yield, after touching as low as 72% during the month, the lowest level reached during this century. Looking further out on the curve, the 30-year municipal yield rose to 93% of the 30-year Treasury yield, rising from its level at the beginning of the month.
Overall, the municipal yield curve flattened during May, and is beginning to resemble the shape of the Treasury yield curve. The 2-10 spread in municipals is still about 0.12% larger than Treasuries, down from 0.34% at the beginning of 2019. Furthermore, the 2-30 spread in municipals is now 0.20% larger than Treasuries, down from 0.41% at the end of April.
Value in the municipal market still exists on the long-end of the curve but spreads have tightened and that value has been more challenging to find over the first 5 months of 2019. However, improving ratios given the decline in Treasury yields should provide attractive entry points in the municipal market over the next several months.
——————————————————————————————————————–
CORPORATE MARKET OVERVIEW:
INVESTMENT GRADE CORPORATE YIELD SUMMARY:

CORPORATE BOND SPREADS VERSUS TREASURIES:

Equity market volatility in May did not deter the corporate bond market. Strong performance for Treasuries and an appetite for investment grade credits supported corporates during the month. The sharp decline in Treasury yields relative to corporates notably widened spreads, but the sector continued its strong start to the year, and May’s performance pushed total return for corporates to 8.4% in 2019. Using the 10-year corporate spread versus Treasury as a benchmark, the difference widened to 1.39%, up 0.14% from the previous month, but still down from 1.59% at the end of 2018.
High-yield bonds, on the other hand, suffered in May. These bonds exhibited their “risk-on” characteristics, falling almost 2%, in concert with equity markets. The global high yield index retreated off its all-time high, but the sector is still delivering a return of 6.55% in 2019, as measured by HYG. Per Lipper, the high-yield market also saw significant outflows of $1.06 billion in the last week of May, as investors’ desire for risk temporarily weakened.
As fears of a yield curve inversion predicting a recession continue to be a topic of debate, many institutions continue to watch the corporate and high-yield bond market for similar clues that the US economy may be in late-cycle. For example. Citibank projects if 10-year Treasury yields fall below 2%, high-yield bond spreads could widen materially to 500 basis points from their current level of 414 basis points. The projection cited a potential yield curve inversion sending a message to the high-yield market and the economy as the reasons behind this anticipated move. Additionally, according to Bloomberg a key measure of global corporate bond market liquidity, the bid-ask spread, is at is weakest level since December. This widening gap developed in May as Treasury yields plunged and stocks dropped on fears of trade wars. This gauge still has room to go before reaching the widest spread achieved in December, but liquidity concerns in this market deserve close attention if heightened equity market volatility endures.
Disclosure: Nothing on this site should ever be considered to be advice, research or an invitation to buy or sell any securities.


