
Fixed Income Market Summary August 2021
Performance Snapshot:
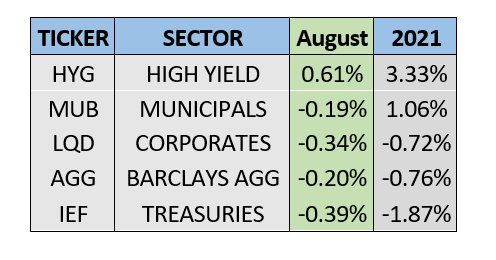
Sector Summary:
US Treasuries: Treasuries experienced choppy trading in August including a late month rally after the Federal Open Market Committee provided more insights on its anticipated removal of accommodative monetary policy. Yields on Treasuries increased across the curve as prices fell. Momentum seems to be picking up in the labor market with a September FOMC meeting in focus.
Municipals: Municipals dropped slightly in August as Washington continues to debate the next move on tax policy. Despite the down month, municipals maintained their positive performance in 2021, the only investment grade sector that can make that claim. Municipal yield ratios versus equivalent Treasuries increased slightly during the month.
Corporates: Corporate bonds dipped in August, reflecting the shifting sentiment in the stock market and down month for US Treasuries. Investment grade corporate spreads have widened from their lows at the end of June, but remaining historically low, leading corporations to take advantage of the ability to issue new securities and refinance existing debt.
TREASURY MARKET OVERVIEW
Yield Summary:
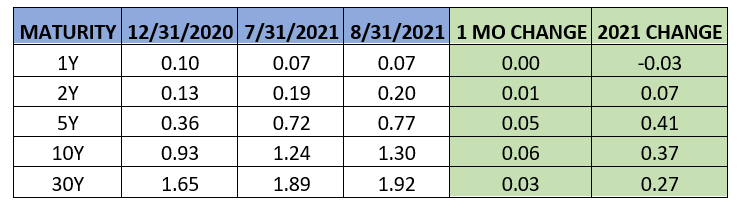
Treasury yields increased slightly in August after strong data on inflation and the labor market early in the month. The jobs report released in August for July employment data showed that 943,000 jobs were added, above the estimate of 845,000, and marking the largest monthly increase since August 2020. In addition, the BLS report indicated that the unemployment rate dropped to 5.4% and average hourly earnings increased more than expected. Similarly, inflation data released in August for July indicated consumer prices rose at a 5.4% annual rate in July. However, core inflation, which excludes food and energy due to their more volatile nature, increased less than expected. All of these data points continue to be the focus of the Federal Open Market Committee as it evaluates its next policy move.
Treasuries rallied in late August after comments from Fed Chair Jay Powell following the FOMC’s annual symposium suggested that the Fed is likely to begin tapering before the end of the year. However, Powell further advised that rate hikes are not imminent as the economy still has “much ground to cover” before hitting full employment. More guidance on the Fed’s next move should come after its next meeting at the end of September.
For the month, the benchmark 10-year US Treasury yield increased from 1.24% to 1.30%. This slight uptick caused Treasury prices to decline 0.39% in August as measured by IEF, the 7-10 Year Treasury ETF. This snapped a streak of four consecutive positive months for Treasuries and maintained the negative performance for the sector that we have witnessed so far in 2021.
With the Fed expected to stay put on its key policy rate and long-term Treasury yields creeping up in August, the yield curve steepened during the month. Using the difference between the yield on the 2-year Treasury and 10-year Treasury as a benchmark, the curve steepened from 1.05% to 1.10% in August. This spread is still well above the 0.8% where it started 2021, as the economic outlook is much improved through the first eight months of 2021. We expect Treasuries to remain under pressure in the near-term as inflation and growth accelerate, although we continue to expect the rise in Treasury yields to be modest through the remainder of the year.
MUNICIPAL MARKET OVERVIEW
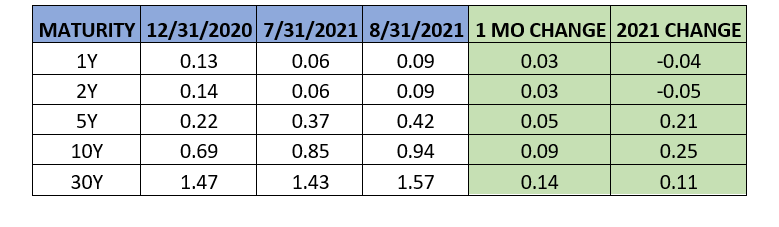
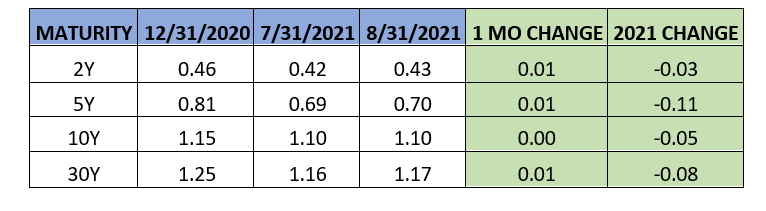
Tax-Exempt Yield Summary:
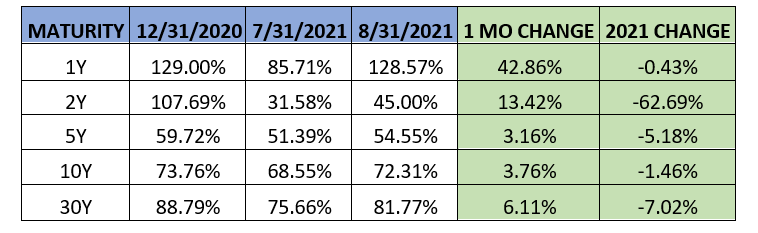
Tax-Exempt Yields as a Percentage of Treasuries:
Municipal bonds generated negative returns in August, breaking a streak of five consecutive positive months which highlighted their steady performance in 2021 amid struggles for most fixed income investors. The sector lost 0.19% during the month as measured by MUB, the benchmark iShares National Municipal ETF. Municipals remain the only investment-grade sector to generate positive returns in 2021, with the Barclays US AGG, US Treasuries and Corporate bonds still in negative territory through August.
Although the tax picture remains unclear, there is a feeling in Washington that taxes will be increasing in the near to intermediate future. As such, municipal investors and institutional buyers remain aggressive in adding money into the municipal market. Per Lipper, fund flows into municipal bonds mutual funds have been positive for 64 of the last 66 weeks, despite historically low absolute and relative yields on municipal bonds. Tax-exempt fund inflows have totaled almost $70 billion year to date. Stable, tax-exempt income remains at a premium for many investors as we await additional direction on future tax policy.
Despite robust supply increases this year, state and local government issuance has been unable to keep up with the incredible demand in this market which continues to compress yields for municipal bonds. Per SIFMA, new issuance for August totaled $41.6 billion, slightly above the 2021 monthly average of $38 billion per month. Taxable municipal sales remain at the highest absolute level since 2010, making up about 25% of 2021 municipal volume, down slightly from 30% for 2020. The hotly contested infrastructure bill is projected to alter the landscape for municipal finance, and more specifically taxable municipal bonds, where we expect a portion of the bill would be funded through this market.
With the municipal market finally experiencing weakness in August, the 10-year AAA municipal benchmark interest rate increased from 0.85% to 0.94%. The municipal yield curve followed Treasuries by steepening during the month. Using the difference between the 2-year AAA municipal yield and the 10-year municipal yield as a benchmark, the municipal yield curve steepened from 0.79% to 0.85%. Municipal yield ratios continued to increase marginally off historically low levels. Specifically, the 10-year AAA municipal yield increased to around 72% at the end of August after dipping below 60% in May. The ratio remains below the long-term average of 80-85% amid the strength in the municipal market and resilient demand. We expect demand to remain solid with taxes in focus and investors placing a considerable value on tax-exempt income in the current environment.
CORPORATE MARKET OVERVIEW
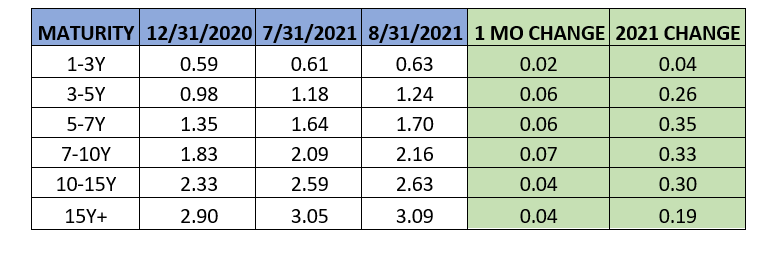
Investment Grade Yield Summary:
Corporate Bond Spreads Versus Treasuries:
Investment grade corporate bonds dipped in August following a strong early summer rally. Corporate bonds followed Treasuries and declined 0.34% for the month as measured by LQD, the benchmark iShares Investment Grade Corporate bond ETF. High yield bonds, on the other hand, gained in August as risk-on sentiment prevailed for much of the month and spreads tightened after experiencing a notable increase in July.
Amid a mostly positive month of economic data, corporate bonds spreads barely moved in August. Using the 10-year corporate spread as a benchmark, corporate spreads did not change from 1.1% for the month. After a rocky first quarter of 2021, corporate bond yields have stabilized, and investors maintain an appetite for investment-grade corporate bonds in the current environment. In the high yield sector of corporate bonds, growth concerns and elevated virus uncertainty caused high yield spreads to widen markedly at the end of July. However, sentiment shifted in August as the spread on the ICE BOA U.S High Yield Index decreased from 3.32% to 3.21% throughout the month. While COVID case numbers climbed in August, high yield spreads tightened, indicating a reduction in market concern by this measure, at least temporarily.
Turning to the supply side of the equation, corporations borrowed $119 billion in August. The monthly average for 2021 is about $175 billion, so corporations lightened their borrowing in the traditionally slower summer months. This comes after issuance of corporate bonds in the first half of 2021 reached the second highest level ever over the first six months of any year, only trailing 2020. We expect supply to pick up going into the end of 2021, with projected issuance in September of $140 billion.