

Fixed Income Market Summary September 2020
Performance Snapshot:
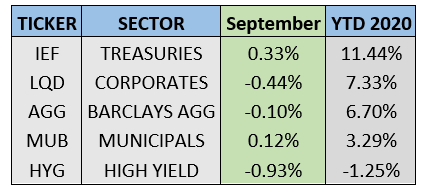
Sector Summary:
US Treasuries: Treasury prices increased in September (yields fell), providing a buffer as equity markets stumbled. The Federal Reserve Open Market Committee met in September and kept its policy rate unchanged, indicating zero interest rate policy will likely be the case for the foreseeable future as the economy tries to regain footing. Inflation continues to be in focus for the committee, which unveiled a new framework for evaluating and monitoring inflation.
Municipals: Municipals eked out a small gain in September, reinforcing their defensive nature amid surrounding volatility. Increased municipal issuance due to seasonality is expected to pick up significantly and met with strong demand. Municipal yield ratios continue to hover above historical averages, indicating relative value in this sector. Lack of clarity from Congress about further aid continues to be a headline in the municipal space.
Corporates: Corporate bond prices, both investment-grade and high-yield, dipped in September along with equities. Corporate spreads widened notably during the month as the outlook of the economic rebound dimmed due to concerns about further stimulus. Bond issuance in the corporate space finally and expectedly reached a new annual record in September.
——————————————————————————————————————————-
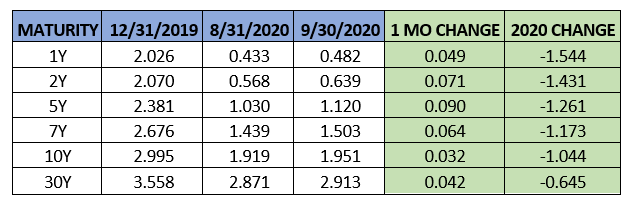
TREASURY MARKET OVERVIEW
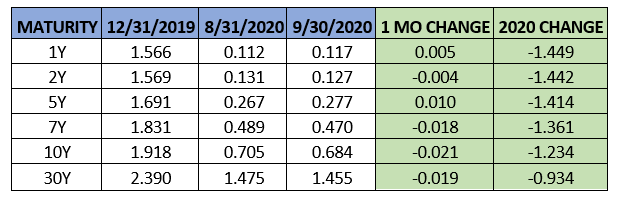
Yield Summary:
The “equity market correction that everyone expected” finally occurred in September. A combination of extended tech valuations, concerns about a smooth US Election cycle and Congressional gridlock restricting additional pandemic-related economic aid brought stocks down for much of the month. From September 2 to September 23, the S&P 500 dropped 9.5% and tech-heavy NASDAQ dropped 12.8%. A late-month bounce kept equity markets off the September 23 lows, and the S&P 500 ultimately finished down 3.7% in September.
This volatility occurred amid improving economic and labor market data and comments from the Federal Reserve about inflation that steepened the yield curve early in September. The upward momentum in yields reversed course as sentiment shifted in the equity markets. Overall, Treasuries returned 0.33% as measured by IEF (7-10 Year Treasury ETF). This sector has been the best performing domestic fixed income sector with elevated volatility for a significant portion of 2020. September showed that Treasuries continue to provide ballast to riskier investments despite their already strong year to date performance and lower current yields.
The Federal Reserve Open Market Committee met on September 15-16, kept its policy rate unchanged and reiterated an accommodative policy stance. The infamous Fed Dot Plot – which projects the committee’s interest rate path by individual members – indicated that individual members believe that the Fed Funds rate will be anchored near zero through 2023. This was the first time the committee forecasted its outlook for 2023. In addition, Fed Chair Powell addressed a new policy regime in which the Fed will allow inflation to run above the 2% target before hiking rates to control inflation, an idea that was initially introduced at the Jackson Hole Symposium in August.
Another notable outcome of the meeting was the committee altering its outlook for GDP, unemployment and inflation. The committee now sees a full-year GDP decline of 3.7%, versus the 6.5% drop in their June projections. However, it lowered its 2021 outlook to 4% from 5% and 2022 growth projection to 3% from 3.5%. The unemployment rate projection declined to 7.6% from 9.3% (the August jobless rate per the BLS data release was 8.4%). Looking at inflation, the committee raised its 2020 inflation projection to 1.2% from 0.8%, though it acknowledged that it does not expect to see its 2% goal until 2023 – a strong reason behind its continued accommodative policy.
After steepening in August, the Treasury yield curve was virtually unchanged in September. Using the difference between the yield on the 2-year Treasury and 10-year Treasury as a benchmark, the curve steepness barely declined from 0.57% to 0.56%. The 10-year Treasury yield closed below 0.7% for the sixth straight month and the Fed has shown no indication that they plan to alter their course, so the steepness of the curve will likely depend on improving growth prospects – which affect longer-term interest rates.
———————————————————————————————————————
MUNICIPAL MARKET OVERVIEW
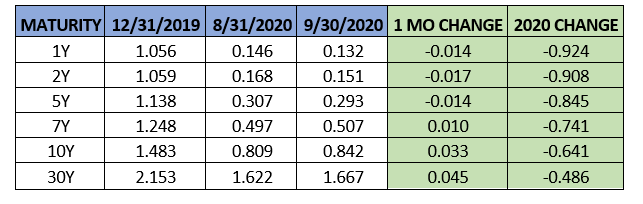
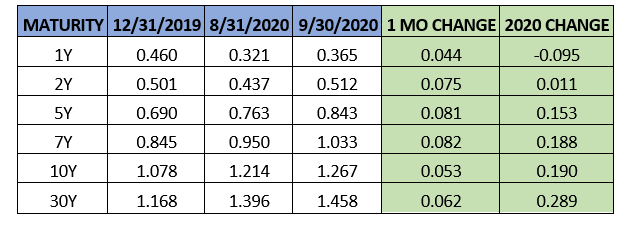
Tax-Exempt Yield Summary:
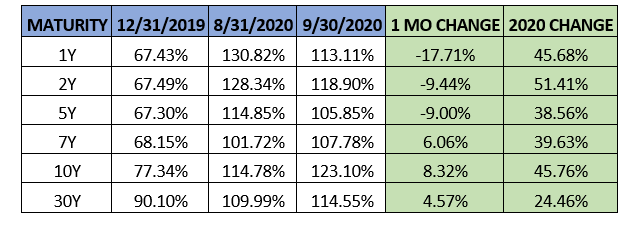
Tax-Exempt Yields as a Percentage of Treasuries:
Municipal bonds gained slightly in September, providing stability after equity market volatility re-emerged. The sector gained 0.12% as measured by MUB, the iShares National Municipal Bond ETF. After closing July at an all-time low of 0.64%, the 10-year AAA municipal benchmark yield increased further after also rising in August, finishing September at 0.84%.
Market activity in September caused the municipal yield curve to steepen during the month, boosted by comments from the Federal Reserve about inflation that also affected the Treasury market. Using the spread between the 2-year AAA yield and 10-year AAA yield, spreads increased from 0.64% to 0.69%. Short-term municipal yields declined slightly in September, and ratios versus Treasuries improved, as near-term budgetary concerns for municipalities simmered. On the longer end, the 10-year AAA muni/TSY ratio closed the month at 123%, a slight increase from last month’s close of 115%. The long-term historical average for this ratio is about 80-85%, so municipals still may have room to tighten with ratios above 100% across the entire curve.
The relative strength of the municipal market in September was largely the consequence of consistent inflows to municipal bond mutual funds. Municipals have not experienced a weekly outflow since mid-April and September was no different. Weekly inflows for the month averaged approximately $1.5 billion. The 60-week inflow streak that ended in March averaged $1.5 billion week, and there is underlying strength in this market from investors looking for tax-exempt income despite solid performance this year.
As investor appetite for municipal bonds remains resilient, issuance approaches record levels. State and local governments, like corporations, continue to take advantage of historically low borrowing costs. Per SIFMA, total municipal issuance in September was $51.9 billion, the largest monthly amount in 2020. This total brings total municipal issuance for the year to $347.1 billion – a 24% increase from the same time frame in 2019. If issuers borrow just the average amount they have sold monthly for the past five years ($32 billion) in the final quarter, that would bring total issuance for the year to $443 billion, which would eclipse the previous record of $424 billion in 2016. This is a very surprising turnaround because municipalities usually restrict borrowing in times of crisis, though more than 33% of this year’s sales were refinancing.
Rising taxable issuance continues to be a big story in the municipal market, where the first nine months of 2020 saw a 227% increase in issuance from 2019, $98.9 billion versus $30.2 billion. We expect this trend to continue as issuers look to entice investors with higher nominal yields and further stimulus and infrastructure could be funneled through the taxable municipal market similar to 2009-10 when the United States emerged from the depths of the Great Financial Crisis.
———————————————————————————————————————
CORPORATE MARKET OVERVIEW
Investment Grade Yield Summary:
Corporate Bond Spreads Versus Treasuries:
Corporate bonds sold off along with equities in September, taking a breather after a strong Q2 and early summer. The sector lost 0.44% during the month, as measured by LQD, the iShares Investment Grade Corporate Bond ETF. High-yield bonds suffered a similar fate, dropping 0.93% and staying in negative territory in 2020 – the only domestic fixed income sector with this designation. Overall, investment-grade corporate bonds have been the best performing credit sector this year.
Credit spreads widened notably across the corporate bond curve as risk-off sentiment prevailed and equity markets corrected. Using the 10-year corporate spread as a benchmark, corporate spreads widened over 5 basis points to 1.27%. This is the highest close of the benchmark spread since June, and is the second consecutive monthly increase in this spread. This comes after the benchmark spread declined for four straight months following the Federal Reserve’s implementation of credit and liquidity facilities in March. Nonetheless, the difference is still well below the 2.45% level where it closed the month of March.
After already reaching a record level in August, corporations borrowed over $200 billion for the fifth time in the last seven months. Per SIFMA, total corporate bond issuance through September is now $1.945 trillion, a 70% increase from the same time in 2019. The previous record occurred in 2017, when corporations borrowed approximately $1.67 trillion. High yield bonds are also expected to reach a new annual record in 2020. High-yield issuers have sold $325 billion so far this year, with the previous record of $332 billion in 2013 on the near-term horizon.
A handful of blue-chip US companies are paying down debt that they borrowed to get through the COVID-19 pandemic. According to Bloomberg, Target, AT&T and CVS Health are among the names that recently announced plans to buy back investment grade bonds, using excess cash to reduce net debt. This is happening after investment-grade companies saw their leverage rise to a record high in the second quarter of 2020, at least by the metric of total debt to EBITDA. This ratio rose to over 4x for investment-grade issuers, after averaging between 2-3x over the last 30 years. These higher debt levels undoubtedly concern investors and explain why companies are eager to pay down debt. However, companies in industries such as technology, telecom and healthcare are more likely to be comfortable paying back debt as the economic recovery has yet to gain significant upward momentum in more affected industries.