
Fixed Income Market Summary August 2020
Performance Snapshot:
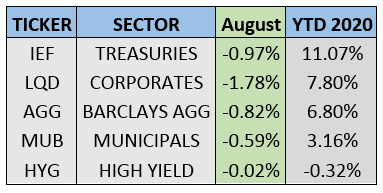
Sector Summary:
US Treasuries: Treasuries declined in August, the first down month since April. Treasury yields rose across the curve as economic data started showing signs of improvement. This in turn led to concerns about future inflation (a catalyst for higher interest rates) despite Federal Reserve Chair Jerome Powell reiterating the Fed’s accommodative policy stance.
Municipals: Municipals generated negative returns in August, following the lead of Treasuries. Sentiment in this market is strong and relative valuations improved despite a down month. Municipal issuance increased further in the latter part of the month, bringing yields off all-time lows. Banks continue to return to the municipal market as a significant buyer.
Corporates: Corporate bond prices, both investment-grade and high-yield, retreated in August despite the risk-on rally. Corporate spreads widened slightly during the month. Issuance continued its surge in August as companies added leverage to their balance sheets while borrowing costs are historically cheap.
——————————————————————————————————————————-
TREASURY MARKET OVERVIEW
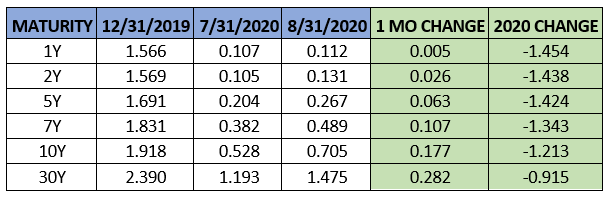
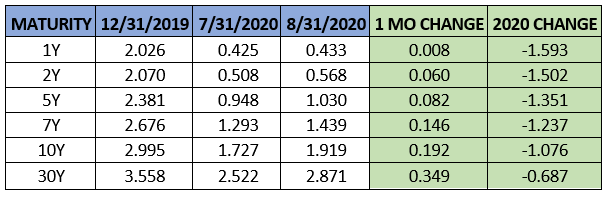
Yield Summary:
The Treasury market softened in August as heavy risk-on sentiment prevailed, with the S&P 500 rallying 7% and the NASDAQ gaining 11%. While the economic outlook remains uncertain, the labor market showed near-term improvement. The headline numbers for the employment report released in August showed a decline in the unemployment rate and re-addition of jobs after the massive job loss earlier in 2020. After initial claims showed an increase late in July, initial claims decline sharply in August, reaching new lows during the pandemic. The weekly average of new jobless claims in August was 1.07 million versus 1.43 million for the previous 2 months. At the very least, these data points are moving in the right direction, although there is a long way to go to return to pre-COVID levels.
With this equity rally and improving economic sentiment, Treasuries declined 0.97% as measured by IEF (7-10 Year Treasury ETF). Total return for 2020 is still above 11%, the best performing domestic fixed income sector.
The increase in Treasury yields was further bolstered by inflation-related comments from Fed Chair Jerome Powell. At last month’s Economic Policy Symposium in Jackson Hole, Powell unveiled a new framework to monitor and control inflation. In short, the Fed scraped its 2% inflation target and will now allow it to run “moderately” above that 2% target. He referenced the challenges presented by higher inflation (using the 1970s as an example) but warned that persistent low inflation over the last several years risks additional economic difficulties. Core personal consumption expenditures, the metric the Fed uses to measure inflation, has averaged 1.6% since 2012. Inflation is running below the target in the current economic cycle as aggregate demand has fallen sharply. However, Powell further indicated that if excessive inflationary pressures were to build, the committee would not hesitate to act.
The next Fed meeting is September 15-16 where the committee will likely expand on the implementation and monitoring of this new policy. We also expect the Fed to continue to reiterate its accommodative policy stance, keeping interest rates bound to 0 until at least 2022.
All this news caused the Treasury yield curve to steepen notably in August. Using the difference between the yield on the 2-year Treasury and 10-year Treasury as a benchmark, the curve steepened from 0.42% to 0.57%. The 10-year Treasury increased 0.18% to close the month at 0.71%, the highest end of month close since February. This was also the largest monthly increase for the benchmark yield since January 2018. At the same time, the real yield on 10-year Treasuries reached a new all-time low of -1.08% on August 31. There is a slight hint of inflation and Treasury yields finally gained a little momentum to the upside in August. We will see if this continues as we head into the last 4 months of 2020.
———————————————————————————————————————
MUNICIPAL MARKET OVERVIEW
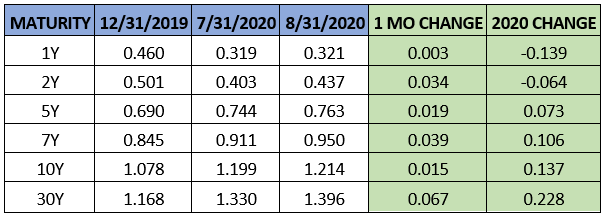
Tax-Exempt Yield Summary:
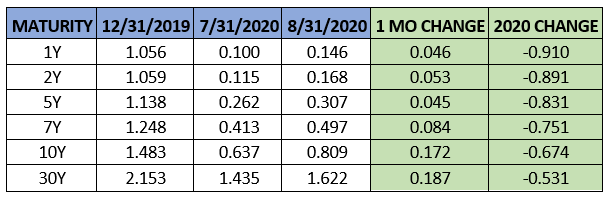
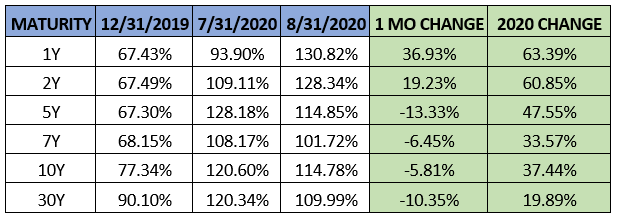
Tax-Exempt Yields as a Percentage of Treasuries:
Municipal bonds declined in August, snapping a 3-month streak of gains. The sector lost 0.59% as measured by MUB, the iShares National Municipal Bond ETF. After closing July at an all-time low of 0.64% and falling even further to a new all-time low of 0.56% on August 7, the 10-year AAA municipal benchmark yield finished August at 0.80%.
Market activity in August caused the municipal yield curve to steepen during the month. Using the spread between the 2-year AAA yield and 10-year AAA yield, spreads increased from 0.52% to 0.64%. Short-term municipal yields increased in August, notably so versus Treasuries with short-term maturities, likely due to lingering concerns over budget shortfalls for many municipalities. On the longer end, the 10-year AAA muni/TSY ratio closed the month at 115%, a slight change from last month’s close of 120%. The long-term historical average for this ratio is about 80-85%, so municipals still may have room to tighten with ratios above 100% across the entire curve.
This softening in the municipal market during August coincided with the increase in Treasury yields and strong new issuance. State and local governments, like corporations, continue to take advantage of historically low borrowing costs. Per SIFMA, total municipal issuance was $41.4 billion in August, bringing total issuance for 2020 to $294 billion – a 21% increase from the same time frame in 2019. This increase is notable, especially after the credit freeze in March when tremendous uncertainty led municipal issuers to pause. The last three months of issuance has averaged $46.1 billion after a $30 billion a month average for the first 5 months of 2020. Much of this increase can be attributed to the jump in taxable municipal issuance which reached $81.3 billion year-to-date. This is a 245% increase for the first 8 months of 2019. We expect this trend to continue as issuers look to entice investors with higher nominal yields.
On the demand side, investors added money to municipal bond mutual funds during each week in August. Municipals have not experienced a weekly outflow since mid-April and the average weekly inflow in August was approximately $1.7 billion. The 60-week inflow streak that ended in March averaged approximately $1.5 billion per week, so municipal inflows have returned to a healthy clip, despite low nominal yields.
Strong demand in the municipal market has been boosted by demand from banks. According to a recent data from the Federal Deposit Insurance Corporation, banks increased their stake in municipal bonds by $20 billion in Q2 2020. This was the second-largest quarterly increase since 2013, and marks a shift from the previous 2 years, when the 2017 tax cuts caused banks to reduce their municipal bond holdings. Banks are just one of several crossover buyers looking beyond compressed spreads and low yields across most credit markets and turning to the tax-exemption and favorable valuations offered by municipals to achieve returns.
———————————————————————————————————————
CORPORATE MARKET OVERVIEW
Investment Grade Yield Summary:
Corporate Bond Spreads Versus Treasuries:
Investment-grade corporate bonds pulled back from their recent hot streak, despite strong risk-on sentiment in August. The sector lost 1.78% during the month, as measured by LQD, the iShares Investment Grade Corporate Bond ETF. High-yield bonds, on the other hand, barely declined. Overall, investment-grade corporate bonds have been the best performing credit sector this year, while high-yield bonds have been the worst, (and only negative) sector.
Credit spreads across the corporate bond curve widened slightly in August, Using the 10-year corporate spread as a benchmark, corporate spreads widened about 1.5 basis points to 1.21%. This is the first monthly increase in this spread since March, when credit spreads widened sharply as pandemic fears shocked the markets. However, this spread is hovering just below 1.23%, where it closed February just before the spread widening and the massive infusion of liquidity and stimulus from the Federal Reserve.
Unseasonably strong issuance added to the already record year for corporate borrowing. In the past, companies often refrained from selling bonds in late August and approaching the Labor Day holiday. Not this year, as US investment-grade issuers sold over $140 billion this month, passing 2016 for the busiest August on record. This brought total issuance for the year to a new annual record, with 4 months remaining. Junk-rated issuers also borrowed $53 billion in August, the second highest of any individual month on record.
Low interest rates and heavy Fed support have been the catalyst for substantial borrowing by corporations trying to stem the negative effects of the pandemic. However, concerns continue to mount regarding the longer-term effects of this borrowing as companies face falling revenues and the potential inability to pay down this new debt load. These concerns are supported by both the ratio of total debt to company earnings before interest, tax, depreciation, and amortization (EBITDA) and the interest coverage ratio, which compares a company’s EBITDA to their interest expense.
According to recent data from Bloomberg, the ratio of total debt/EBITDA for investment-grade issuers increased to 3.53x in Q2 2020. This is up from 3.42x for the first three months of 2020, when the impact of the pandemic began to show up in earnings. This is well above the 20-year average of 2.65x. For junk-rated issuers, this ratio eclipsed 5x after averaging slightly above 4x for the last 20 years. In sum, companies are adding to their leverage by issuing more debt as a multiple of their earnings.
Similarly, the interest coverage ratio for investment-grade companies fell to 5.8x in June, the lowest level since 2003. The 20-year average for this metric is closer to 7x for investment-grade issuers, with a recent high around 9x reached in 2014. For junk-rated companies, the interest coverage ratio fell to 2.3x, also the lowest since June 2003. This metric also shows deterioration, as companies have fewer earnings as a multiple of their interest expense than the longer-term historical average. While all is relatively calm in the corporate bond market due in large part to the credit facilities provided by the Federal Reserve, there appears to be trouble brewing in these underlying fundamentals. Many companies have already become casualties of this economic wipeout. Unfortunately, we expect this to continue as it will be challenging for these ratios to improve until there is a sustained increase in economic activity or a decrease in borrowing. Investors in corporate bonds should continue to traffic in higher quality borrowers to avoid these significant risks.