
Fixed Income Market Summary July 2020
Performance Snapshot:
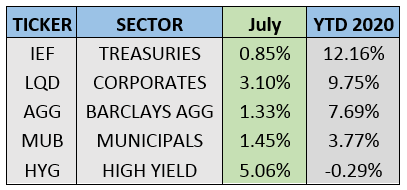
Sector Summary:
US Treasuries: Treasuries continued their year-to-date rally, generating positive performance in July. Treasury prices gained across the curve and reached fresh-all time low yields in various maturities. Slumping growth and muted inflation expectations perpetuated a decline in real yields. The Federal Reserve Open Market Committee met at the end of July, leaving its policy rate unchanged and maintaining its pace of open market operations.
Municipals: Municipals extended their recovery in July, the third straight month of gains. Improving sentiment and attractive relative valuations brought investors back into this sector and drove yields to all-time lows on the AAA muni benchmark. Refunding and issuance surged in July due to these lower borrowing costs, as state and local governments look for cash to cover budget shortfalls. Taxable municipal bonds continue to become a larger part of this market with increased issuance and investors are rewarded with larger spreads.
Corporates: Corporate bonds recorded another strong month, leading the way as the best performing sector in July. High-yield bonds also rallied, flirting with a return to positive territory year-to-date. Corporate bond investors have been rewarded for owning quality so far in 2020, despite rapidly declining spreads across the entire corporate bond sector. Record corporate bond issuance continued as companies lock in lower funding rates and retire short-term obligations.
——————————————————————————————————————————-
TREASURY MARKET OVERVIEW
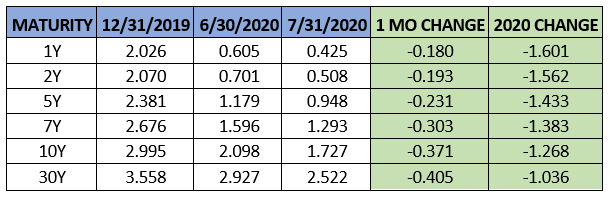
Yield Summary:
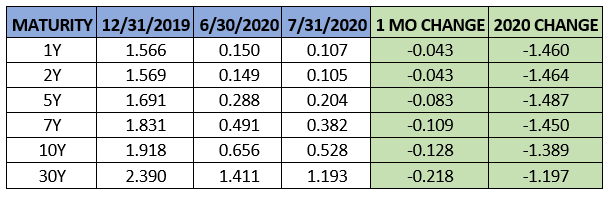
The rally in Treasuries continued amidst the grim economic outlook, in addition to the weak Q2 US GDP release and softening labor market data. US GDP fell by a record 32.9% annual pace in the second quarter, better than estimates. However, this figure was far worse than the steepest quarterly drop (-8.4%) during the Great Financial Crisis in 2008. This eye-popping decline was not horribly surprising, but jobless claims rose for two straight weeks to close the month after steadily declining off April highs. Additional unemployment payments from the first stimulus package are set to expire at the end July, so this data is very concerning.
Against this backdrop Treasuries generated a return of 0.85% in July as measured by IEF (7-10 Year Treasury ETF). This brings total return for the ETF over 12% for the year, the best performing fixed income sector this year. Investors continue to seek safety in Treasuries despite their extremely low yields. In fact, 10-year Treasury yields joined 2, 5 and 7-year Treasury yields by finishing July at the lowest monthly closing yield of all-time. The benchmark 10-year yield had not finished at a new low since April 2020. Fed influence is certainly an important factor, but we continue to believe the lack of upward momentum in yields implies investor caution along with steadily declining economic growth expectations.
The Federal Reserve Open Market Committee met on July 28-29 and left its benchmark interest rate unchanged. The Fed continued its pace of open market operations, maintaining the size of its balance sheet around $7 trillion where it has been since mid-May after the explosion in size from the initial COVID stimulus response in March. Nonetheless, Fed Chair Jerome Powell indicated that greater support may be required from both the Fed and Congress. Specifically, he noted in his press conference the importance of fiscal authorities to give money directly to individuals and businesses, whereas the central bank only has lending powers. In addition, he pointed out that the committee believes this is a disinflationary shock and it expects core inflation to drop to 1%.
Gold and the dollar, two barometers of inflation are telling a different story. The dollar weakened over 4% in July and gold continued a meteoric rise to an all-time high near $2,000/oz. However, also of note is the sharply declining real yield of US Treasury bonds, which typically would indicate waning growth and inflation expectations. The benchmark 10-year real US Treasury yield closed July at -1.02%, the lowest of all-time. At the same time, Treasury Inflation Protected Securities (TIPS) have outperformed Treasuries each of the last 4 months, a performance trend that we witnessed in past crises. Following the Global Financial Crisis in 2008, inflation eventually increased due to massive stimulus which followed a demand-driven deflation shock. With several conflicting data points, we will ultimately have to wait to see if the Fed’s assessment turns out to be accurate.
———————————————————————————————————————
MUNICIPAL MARKET OVERVIEW
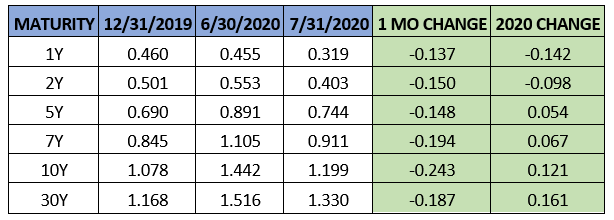
Tax-Exempt Yield Summary:
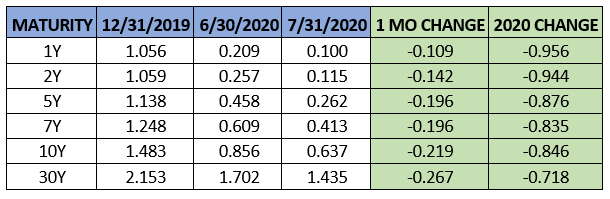
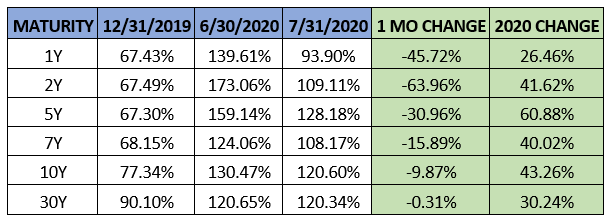
Tax-Exempt Yields as a Percentage of Treasuries:
Municipal bonds stretched their streak of positive performance to three consecutive months, gaining 1.45% as measured by MUB – the iShares National Municipal Bond ETF. Despite the bleak economic picture and recent spike in COVID cases after the attempted reopening in June, the muni market managed to sidestep the pain and devastation that many small businesses and individuals face. In fact, issuers have never been able to borrow more cheaply.
The 10-year AAA municipal benchmark yield finished July at 0.64%, an all-time low. Investors were undeterred by these low yields, adding money to municipal bond mutual funds in each week during July, increasing to a weekly inflow of $2.1 billion in the final week. The sector has not experienced a weekly outflow since April as the fear that roiled the muni market at that time has subsided since then.
This positive sentiment caused the municipal yield curve to flatten as yields on longer-term maturities fell further in July. Using the spread between the 2-year AAA yield and 10-year AAA yield, spreads narrowed from 0.60% to 0.52%. The 10-year AAA muni/TSY ratio closed the month at 120%, a slight change from last month’s close of 130%. The long-term historical average for this ratio is about 80-85%, so municipals still may have room to run with ratios above 100% across most of the curve.
On the supply side, about $46 billion of new bonds were sold in July, a 58% increase from a year ago during a month that is usually slower due to seasonality. This is the busiest issuance for July since 2013. This brings total issuance in 2020 to $250 billion, a 23% increase over the same time frame in 2019. The sharp increase in taxable issuance continues to be a significant development in the municipal market. Taxable municipal issuance totaled $18.1 billion in July, already eclipsing total taxable issuance for 2019 and three times greater than taxable issuance in the first seven months of 2019.
A recent piece by Bloomberg where they discussed the resilience of the muni market with the rating agencies (Fitch, Moody’s and S&P) offers insight into how most states and local governments have avoided a catastrophe in the face of this pandemic.
First, with very few exceptions, issuers entered this year in very fiscally fit condition with built up reserves and rainy-day funds on the tail end of the economic expansion since 2009. In addition, municipalities were not overleveraged, despite declining and historically low interest rates – the municipal market has maintained its size around $3.8 – $3.9 trillion for most of the last decade. The same cannot be said for the US Treasury or US corporations, who seized the opportunity to issue debt with these low yields at a record pace, a trend which has not stopped in 2020. Secondly, the ratings companies noted that state and local governments have agency. Specifically, in times of trouble, they adjust. In this situation, that came in the form of cutting payroll, raising taxes, trimming programs, and slashing spending. While none of these are desirable moves, the issuers must be dynamic amid an unprecedented crisis.
The last major point the piece highlights is that not every state and municipality has experienced the pandemic in the same way as New York City or Las Vegas for example, two cities which rely on tourism and entertainment dollars. Said differently, the pandemic has had an outsized impact on a relatively small number of issuers. Per S&P, the ratings and outlook actions since March have represented about 6% of their rated universe. While there are certainly issuers under pressure, putting them all in the same boat is not an appropriate comparison.
———————————————————————————————————————
CORPORATE MARKET OVERVIEW
Investment Grade Yield Summary:
Corporate Bond Spreads Versus Treasuries:
Investment grade corporate bonds delivered another strong month of performance in June, returning 3.1% as measured by LQD, the iShares Investment Grade Corporate Bond ETF. Similarly, high yield bonds rallied sharply in July, generating returns over 5%. Despite this high yield rally, corporate bond investors have been most rewarded for owning quality in 2020. Per State Street Global Advisors, AAA corporate bonds have returned 13% YTD while BB bonds have earned 3.6%, and all credits rated below B are in negative territory. Overall, the high yield sector is still slightly negative for the year.
Credit spreads across the corporate bond spectrum continued to tighten noticeably in July, further boosted by record liquidity from the Federal Reserve as the global search for yield becomes more challenging. Using the 10-year corporate spread as a benchmark, corporate spreads tightened 24 basis points in July, a larger decline in spreads than we saw in June. The spread sits at 120 basis points, approaching the same level where it began the year. We are seeing a similar trend in high yield, where spreads are currently 488 basis points, as measured by the Bloomberg Barclays US Corporate High Yield index. Despite growing economic uncertainty, this is notably below the 20-year average of 550 basis points.
Corporate bond issuance slowed tremendously in July, but still totaled $93.3 billion, per SIFMA. Issuance over the first half of 2020 averaged almost $240 billion per month. Nonetheless, corporate issuance is still up 79% from the same time frame in 2019. After a monthly record of issuance in June, high yield slowed as well, with only $25.6 billion of new bonds. This dwindling supply is another reason why spreads have compressed in recent months. In the face of significant headline risk and big-name bankruptcies happening on a regular basis, investors have not been deterred from investing in corporate and high yield bonds this year. These two segments fixed income have seen the largest asset growth in ETFs in 2020, after another strong month in July. A lot of this undoubtedly occurred since the Federal Reserve announced its intentions to buy single CUSIP corporate debt as well as credit focused ETFs, although actual purchases have been minimal to date. With 25% of global debt offering negative yields, investors must try harder than ever to generate yield, a problem compounded by unprecedented economic uncertainty. We expect this to be a challenge for the foreseeable future, but for now, the corporate market remains robust due to the Fed backstop.