Fixed Income Market Summary – June 2019
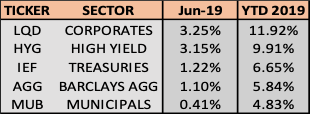
Performance Snapshot

Note: While equities have been strong, so have bonds. In fact, all domestic fixed income sectors have outperformed the S&P 500 since 10/1/2018
US Treasuries: An equity market rebound in June did not prevent Treasuries from posting another strong month. Yields declined across the curve, with the benchmark 10-year yield reaching a 2019 low of 1.98% on June 25, before closing the month right at 2%. The Federal Reserve provided support for the Treasury market as it pivoted its policy stance to accommodative, citing weakening economic outlook. As a result, the Treasury yield curve steepened, with shorter-term rates declining sharply on the renewed possibility of a Fed rate cut.
Municipals: Municipal bonds gained during June, wrapping up the first half of 2019 without experiencing a single monthly decline. Yields declined across the short to intermediate part of the yield curve, and long-term yields held steady. Municipal yield ratios versus equivalent Treasuries rose slightly again in June, providing a bit more relief for a market that was historically expensive versus Treasuries. Expected increases in supply should keep prices in check.
Corporates: Investment grade corporates closed out a historically strong first half to the year. Tightening credit spreads supported this market, as domestic and global investors continue to search for yield. High yield bonds bounced back in June, but investment grade bonds may offer more attractive risk/reward with economic uncertainty a growing concern.
——————————————————————————————————————-
TREASURY MARKET OVERVIEW
Yield Summary:

Treasuries continued right along after a strong May and posted a healthy gain in June. On June 25, the 10-year Treasury yield closed below 2% for the first time since November 2016. The benchmark yield ultimately closed the month at 2%, down 0.68% from the beginning of 2019.
The Federal Reserve met in June and kept the benchmark Federal Funds rate constant at 2.25-2.5%. Positive headlines related to trade negotiations between the US and China conflicted with a weak May employment report released at the beginning of June. The US added only 75,000 jobs and hourly earnings grew less than expected. In addition, the global growth outlook continues to dim, and the lack of inflation led the voting members of the committee to keep rates steady during June.
Looking ahead, the market expects the Fed to cut rates, with interest rate futures currently pricing in a 100% probability of a cut at the next meeting on July 31. This would be the first rate cut since 2008 and comes as a bit of a surprise as unemployment hovers at 50-year lows and equity markets continue to reach new all-time highs. However, it appears the unfavorable outlook and political pressure may outweigh these positives and lead to easing. This pivot in policy stance has essentially been baked into asset prices, so any deviation could shock the markets and uncover pent-up volatility.
The Treasury yield curve steepened slightly during June, as market expectations for a rate cut exuded a greater effect on short-term yields. The 2-10 spread widened to 0.25% at the end of June, the largest month-end differential in 2019. Although the 10-year Treasury sits well below the current Federal Funds rate, expected rate cuts over the remainder of 2019 should keep the 2-10 spread in check, avoiding a potential inversion.
——————————————————————————————————————-
MUNICIPAL MARKET OVERVIEW:
TAX-EXEMPT YIELD SUMMARY:

TAX-EXEMPT YIELDS AS A PERCENTAGE OF TREASURIES:

Municipal bonds gained for the 8th consecutive month, the only domestic fixed income sector that can make that claim. Municipal yields declined across most of the curve, with just the long-end yields remaining steady in June. The sector continued its steady returns, but trailed Treasuries and relative valuations versus Treasuries continued to improve. The 10-year AAA Municipal benchmark yield closed the month at 1.62%, grinding lower and reaching new lows since October 2016.
Municipals were boosted in the first half of the year by continued strong demand. According to the Investment Company Institute, municipal bond mutual funds continued the trend of positive inflows during June, extending the streak to 25 consecutive weeks, the longest since 2016.
An anticipated pick up in supply during the second half of 2019 could potentially provide relief from stretched valuations. New debt sales in the municipal market totaled $164 billion in 2019 to date, a 6% increase over the 2018 pace. Several institutional asset managers, including Bank of America and Barclays, expect the issuance for the remainder of 2019 to exceed $200 billion. These projections rely on the declining interest rate environment, which make it cheaper for local and state governments to issue bonds, as the main reason for the supply increase. This expected increase in supply should be met with strong demand, but could continue to loosen up the municipal market, which has yet to show any signs of weakness in 2019.
Municipal bonds are relatively rich when looking at yields versus equivalent Treasuries, although ratios continued improve in June from historic lows. Specifically, the 10-year municipal yield rose to 81% of the 10-year Treasury yield, after touching a low of 72% in May, the lowest level reached during this century. For context, this ratio averaged 93% over the last 20 years. Despite these dynamics, for income seekers in higher tax brackets, municipals’ tax-equivalent yield continues to be attractive.
The municipal yield curve steepened sharply during June, following the lead of Treasuries. Expectations of a Fed rate cut caused a sharp decline in the short end of the yield curve, with the 2-year municipal yield experiencing the biggest one-day drop since June 2018. The 2-10 spread in municipals narrowed to about 0.08% larger than Treasuries, down from 0.32% at the beginning of 2019. Furthermore, the 2-30 spread in municipals is now 0.34% larger than Treasuries, down from 0.76% at the end of April. Overall in 2019, the municipal yield curve has flattened while the Treasury curve has steepened slightly.
As a result, value in the municipal market remains in the long end of the curve and is more challenging to find attractive yields with short maturities. However, improving ratios as a consequence of declining Treasury yields should provide attractive entry points in the municipal market over the next several months.
——————————————————————————————————————–
CORPORATE MARKET OVERVIEW:
INVESTMENT GRADE YIELD SUMMARY:

CORPORATE BOND SPREADS VERSUS TREASURIES:

Corporate bonds extended a red-hot start to 2019 as returns reached 11.92% over the first 6 months, the best start in over 20 years. If corporate bonds returned 0% for the remainder of 2019, it would be the best year since 2009, when corporates returned 13.5%. High-yield bonds rebounded in June right along with equities. The sector reached another all-time high on June 19, but still trails the performance of the investment grade corporate sector.
While the Federal Reserve rhetoric supported all fixed income markets in June, a big reason for corporate bonds’ solid performance was the tightening of corporate spreads. Using the 10-year corporate spread versus Treasuries as a benchmark, the difference narrowed to 1.24%, down 0.16% from the end of May, and well below the 1.59% at the end of 2018. Tightening spreads typically indicate economic strength, so this signal runs contrary to assessments made by the Fed and other economists of a weakening economic outlook. Something must give, and this data point warrants close attention.
Despite the talk of slowing economic conditions, the market maintains an appetite for large new debt issues, as evidenced by Abbvie’s $38 billion of additional debt as part of its $63 billion acquisition of Allergan.
Disclosure: Nothing on this site should ever be considered to be advice, research or an invitation to buy or sell any securities.


