
Fixed Income Market Summary May 2021
Performance Snapshot:
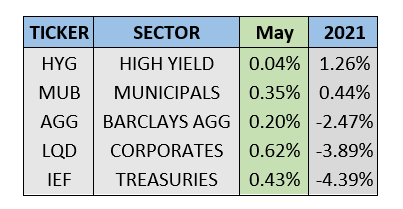
Sector Summary:
US Treasuries: After a disappointing jobs report, Treasuries fluctuated for much of May. Treasury bond yields for intermediate to long-term maturities declined, supporting prices for a second consecutive month. Economic data and inflation remain a key driver of Treasury yields with the upcoming employment report in focus. The Federal Reserve Open Market Committee plans to meet in June and this key labor market update will likely provide insight into the timing of the Fed’s planned tapering of asset purchases.
Municipals: Municipals continued their climb up in May on the heels of increased conversation in Washington regarding tax policy. The tax-advantaged status of municipal bonds has buoyed their returns versus other fixed income sectors for much of 2021 as investors continue to pour money into this sector. Municipal yield ratios versus equivalent Treasuries hovered near historically expensive levels in May.
Corporates: Corporate bond prices put together a second consecutive solid month in May. After a shaky April employment report, improvement in economic data in the later portion of the month provided support for corporate bonds. Projected issuance in the corporate market is expected to pick up heading into the summer.
TREASURY MARKET OVERVIEW
Yield Summary:
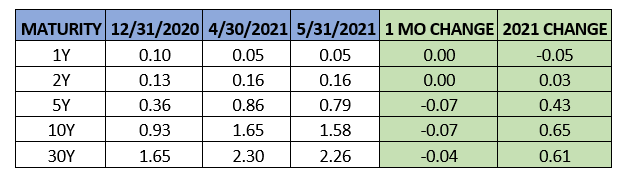
Treasury yields continued their retreat from their highest levels since the onset of the COVID-19 pandemic. Yields declined across the intermediate-long end of the Treasury curve as the disappointing jobs report released in early May gave investors confidence that the Federal Reserve will remain patient and accommodative with its monetary policy support. Hiring was a huge letdown in April with nonfarm payrolls increasing by 266,000, much less than the consensus projection as the labor market lost a bit of momentum it had gained earlier in 2021.
Despite the disappointing report, inflation chatter re-emerged in May after April CPI showed a 4.2% annual increase, the highest annual reading since September 2008. Many economists attribute the price gains to the base effect – at this time a year ago, the economy was hit with the worst of the COVID-19 pandemic and inflation was unusually low. However, as supply chain disruption continues and with pent-up consumer demand anticipated, these inflation pressures are expected to linger despite the Federal Reserve deeming these effects “transitory.”
Put all this together, and the benchmark 10-year Treasury yield declined from 1.65% to 1.58% in April. This decrease in yields supported prices, and Treasuries gained 0.43% in May as measured by IEF, the 7-10 Year Treasury ETF.
The Federal Open Market Committee did not meet in May and has its next meeting scheduled for the middle of June. Investors will continue to keep a close eye on the monthly CPI readings in addition to labor market updates as these are key inputs that the Federal Reserve uses to govern its monetary policy.
With the Fed expected to stay put on its key policy rate and long-term Treasury yields declining in May, the yield curve flattened during the month. Using the difference between the yield on the 2-year Treasury and 10-year Treasury as a benchmark, the curve flatted from 1.49% to 1.42% in April. This spread is still well above the 0.8% where it started 2021, as the economic outlook is much improved through the first five months of 2021. We expect Treasuries to remain under pressure in the near-term as inflation and growth accelerate, although we continue to expect the rise in Treasury yields to be modest through the remainder of the year.
MUNICIPAL MARKET OVERVIEW
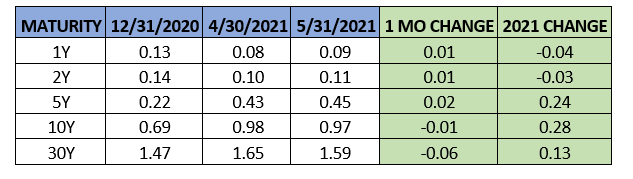
Tax-Exempt Yield Summary:
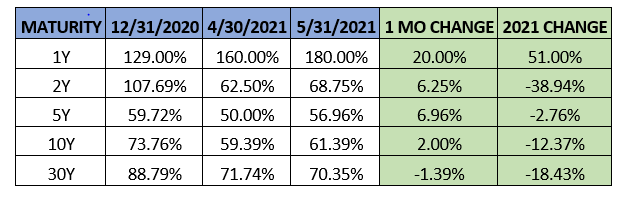
Tax-Exempt Yields as a Percentage of Treasuries:
Municipal bonds continued to show strength in May, generating another month of positive returns. The sector gained 0.35% in May, as measured by MUB, the benchmark iShares National Municipal ETF. Municipals are the only investment-grade sector to generate positive returns in 2021 as the first five months of 2021 have proved challenging for fixed income investors across the globe. The Barclays US AGG is still down about 2.5% and YTD losses for Treasuries and Corporate bonds are hovering around 4%.
As President Biden continues to focus on adjusting tax rates, investors and institutional buyers, have piled into the municipal market. Per Lipper, fund flows into municipal bonds have been positive for 52 of the last 54 weeks, despite municipal bonds reaching historically expensive levels. Tax-exempt income remains at a premium for many investors with the prospect of increasing taxes on the horizon. In addition, municipal investors are not discriminating on credit as high-yield municipal bonds continue to see record inflows in this yield-starved market environment.
This overpowering demand easily absorbed new issuance supply in the municipal market in May as state and local governments continue to benefit from cheap financing due to low interest rates. Per SIFMA, new issuance for May totaled $32.1 billion, which is slightly below the $36 billion average the municipal market experienced in the first four months of 2021. Despite headlines of a supply shortage in the municipal market, issuance for the first five months of this year is the highest since 2017, and well above the historical average. Taxable municipal sales at this point in the year are the highest since 2010. About 25% of this year’s volume has been taxable, down slightly from 30% for 2020 as Treasury yields rose notably amid the improving economic outlook. The forthcoming infrastructure bill is projected to alter the landscape for municipal finance, and more specifically taxable municipal issuance, where a portion of the bill could be funded through this market similar to the Build America program in 2009-2010.
With this supply and demand interplay providing strength to the municipal market, the 10-year AAA benchmark barely budged in May, declining from 0.98% to 0.97%. The municipal bond yield curve flattened slightly as well – using the difference between the 2-year AAA muni yield and the 10-year muni yield as a benchmark, the municipal yield curve flattened from 0.88% to 0.86%. For the first time in seven months, municipals did not outperform US Treasuries in May. As a result, municipal yield ratios backed off historically low levels. Specifically, the 10-year AAA municipal yield increased from 59.4% to 61.4%. This ratio still remains well below the long-term average of 80-85% as municipals have exhibited significant strength in 2021. We expect this to slow at some point but there is currently overwhelming positive sentiment in the municipal bond market.
CORPORATE MARKET OVERVIEW
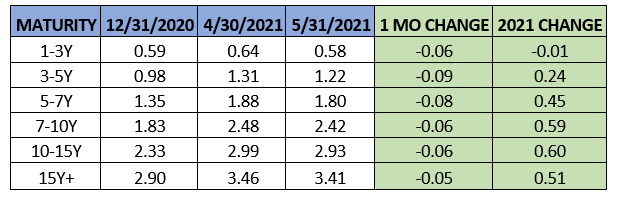
Investment Grade Yield Summary:
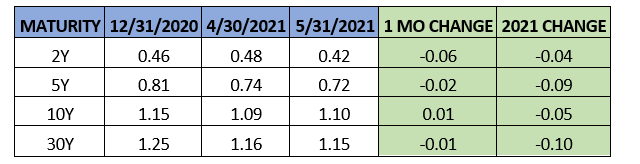
Corporate Bond Spreads Versus Treasuries:
Investment-grade corporate bonds were the leading performer among domestic fixed income sectors in May. Corporate bonds gained 0.62% for the month as measured by LQD, the benchmark iShares Investment Grade Corporate Bond ETF. High yield bonds also gained slightly in May despite a choppy month for equities. The high yield bond sector continues to be buoyed by rising commodity prices, specifically oil and gas, an area where many high yield issuers generate a significant portion of their revenues. Historical data shows that in an environment with a steepening Treasury yield curve, high yield bonds tend to outperform as has been the case for the majority of 2021.
A key development in the corporate bond market is the prospect that the Federal Reserve will begin winding down its holdings of corporate bonds and corporate bond ETFs that the central bank acquired last year amid the COVID-19 pandemic. The move would mark a notable action towards removing monetary accommodation. However, there is not an expectation that these sales would have a significant impact on spreads as the liquidation will equal approximately 0.14% of secondary trading volumes through the end of the year, per Nuveen.
A mixed month of economic data and equity market volatility kept corporate bond spreads around the same level at the end of May as the previous month. Using the 10-year corporate spread as a benchmark, corporate spreads increased from 1.09% to 1.1%. Nonetheless, after posting the worst quarterly performance since 1980 in the first quarter, investment grade corporates have rallied for two consecutive months. Fund flows totaled $911 million, continuing a multi-month streak of positive demand. In the face of challenging few months for corporate bonds and rising yields overall, there is still ample demand for corporate bonds.
On the supply side, corporations borrowed $175.5 billion in May, per SIFMA. This amount of corporate bond issuance is slightly below the YTD monthly average of $195 billion. The monthly average for 2020 was $190 billion when corporations issued a record amount of debt. In the high yield market, issuance in May totaled $52.9 billion, right around its 2021 monthly average. High yield bond issuance is currently on pace for well above $600 billion for 2021, which would crush the annual record of $421 billion last year. Robust demand for speculative credit continues to support the high yield bond market as the global search for yield persists in the current low interest rate environment.