
Fixed Income Market Summary July 2021
Performance Snapshot:
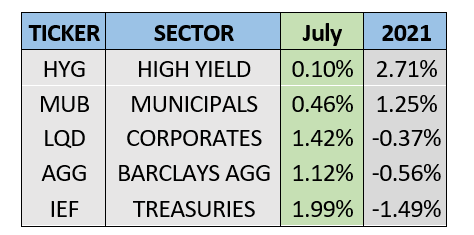
Sector Summary:
US Treasuries: Treasuries rallied for most of July despite an improving labor market and strong inflation data. Yields on Treasuries with intermediate to long-term maturities declined sharply, leading to the best monthly performance since March 2020. The Federal Open Market Committee met in July and is focused on the next labor market update which may move up the timeline of the Fed’s planned asset purchase tapering.
Municipals: Municipals maintained their steady performance in July as Washington continues the tax policy conversation. The tax-advantaged nature of municipal bonds has supported performance all year and municipals have led the way among investment grade fixed income sectors. Municipal yield ratios versus equivalent Treasuries hovered near historically expensive levels in July.
Corporates: Corporate bonds rallied in July, mirroring the stock market strength and improving economic data. Corporate spreads for investment grade bonds over US Treasuries widened slightly in July, while high yield spreads experienced a more pronounced increase. Corporate bonds remain on track for another strong year of issuance as companies look to lock in low-cost funding before the expected removal of the Federal Reserve’s monetary support.
TREASURY MARKET OVERVIEW
Yield Summary:
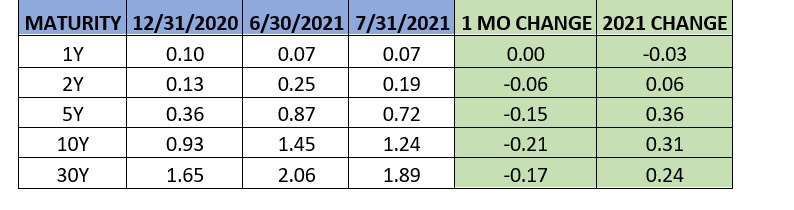
Treasury yields dropped notably in July, despite upbeat news from the labor market and strong signs of inflation both in wages and consumer prices. The jobs report released in July for June employment data indicated that 850,000 jobs were added, above the expectation of 706,000 and slightly above the number of jobs added in the previous two months combined. Additional data showed that wages grew at a 3.6% annualized rate, returning back above the long-term growth rate of 3%. Consumer price posted their strongest annual growth since 2008 at 5.4% based on a report released in July, reigniting at least some inflation talks despite the Federal Reserve considering these price increases as transitory.
Nonetheless, yields declined sharply across the intermediate to long end of the Treasury curve, continuing a trend that started when the 10-year Treasury peaked in mid-May. Treasury yields also stayed firm after the Fed press conference at the end of the month where Chairman Powell indicated that the FOMC is nowhere near considering a rate hike.
For the month, the benchmark 10-year US Treasury yield declined from 1.45% to 1.24%. This sharp drop in interest rates supported prices and Treasuries gained 1.99% in July, as measured by IEF, the 7-10 Year Treasury ETF. This was the best month for Treasuries since March 2020 and the fourth consecutive month of positive returns. This is a complete reversal from the first quarter of 2021 when Treasuries declined in price each month and posted a loss of almost 6%.
The Federal Open Market Committee met at the end of July and did not make any adjustments to its monetary policy. In the statement published after the meeting, committee members unanimously agreed that the economy continues to strengthen. That being said, Chairman Powell reiterated that “substantial further progress” must be made before the committee removes its accommodative monetary policy and raises its benchmark interest rate. Investors will continue to keep a close eye on the monthly CPI readings in addition to labor market updates as these are key inputs that the Federal Reserve uses to govern its monetary policy.
With the Fed expected to stay put on its key policy rate and long-term Treasury yields declining in July, the yield curve distinctly flattened during the month. Using the difference between the yield on the 2-year Treasury and 10-year Treasury as a benchmark, the curve flatted from 1.20% to 1.05% in July. This spread is still well above the 0.8% where it started 2021, as the economic outlook is much improved through the first seven months of 2021. We expect Treasuries to remain under pressure in the near-term as inflation and growth accelerate, although we continue to expect the rise in Treasury yields to be modest through the remainder of the year.
MUNICIPAL MARKET OVERVIEW
Tax-Exempt Yield Summary:
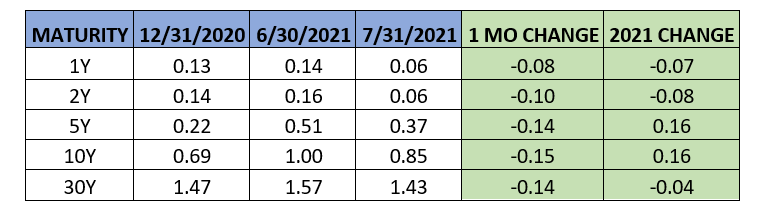
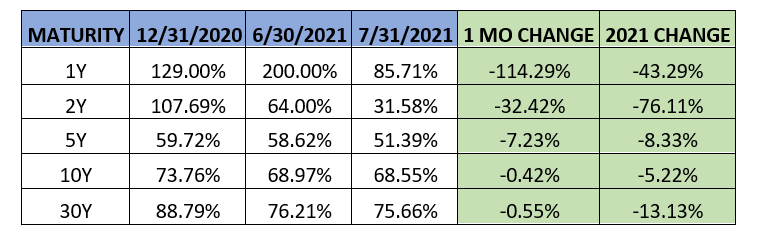
Tax-Exempt Yields as a Percentage of Treasuries:
Municipal bonds turned in a fifth consecutive positive month, continuing their steady performance for most of 2021. The sector gained 0.46% in July, as measured by MUB, the benchmark iShares National Municipal ETF. Despite the rebound in most areas of fixed income over the last three months, Municipals remain the only investment-grade sector to generate positive returns in 2021 – the Barclays US AGG is still down about 0.5% and YTD returns for Treasuries and Corporate bonds are also negative.
As Congress mulls over an infrastructure bill that may also lead to an increase in taxes as a means to fund a portion of the package, municipal investors and institutional buyers continue to pour money into the municipal market. Per Lipper, fund flows into municipal bonds have been positive for 60 of the last 62 weeks, despite municipal bonds reaching and maintaining historically expensive levels throughout much of this year. The strength in demand has achieved record levels as $56.9 billion has been added to municipal bond funds in the first half of 2021, the highest for the first half of a year since 1992. Tax-exempt income remains at a premium for many investors with the prospect of increasing taxes on the horizon.
This strength in demand has overpowered the healthy supply of new issuance in the municipal market, putting downward pressure on interest rates for state and local government debt. Per SIFMA, new issuance for July totaled $34.3 billion, right around the monthly average in 2021. Taxable municipal sales remain at the highest absolute level since 2010, with about 25% of 2021 municipal volume as taxable, down slightly from 30% for 2020 as Treasury yields have risen so far this year. The forthcoming infrastructure bill is projected to alter the landscape for municipal finance, and more specifically taxable municipal bonds, where we expect a portion of the bill would be funded through this market.
With the municipal market experiencing underlying strength, the 10-year AAA municipal benchmark interest rate declined notably in July from 1% to 0.85%, The municipal yield curve followed suit with Treasuries by flattening during the month – using the difference between the 2-year AAA municipal yield and the 10-year municipal yield as a benchmark, the municipal yield curve flattened from 0.84% to 0.79%. Despite steady performance for much of the year, municipals underperformed Treasuries in June and July. On a positive note, municipal yield ratios increased off historically low levels. Specifically, the 10-year AAA municipal yield increased to around 70% after dipping below 60% in May. The ratio remains below the long-term average of 80-85% amid the strength in the municipal market and resilient demand. We expect demand to remain solid with taxes in focus and investors placing a considerable value on tax-exempt income in the current environment.
CORPORATE MARKET OVERVIEW
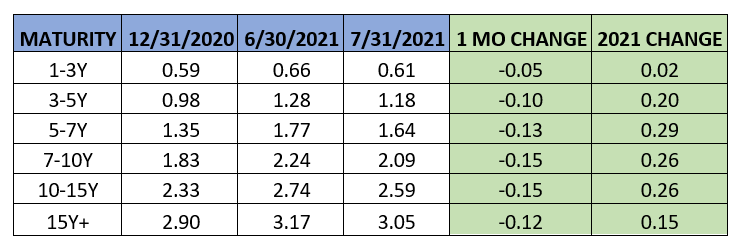
Investment Grade Yield Summary:
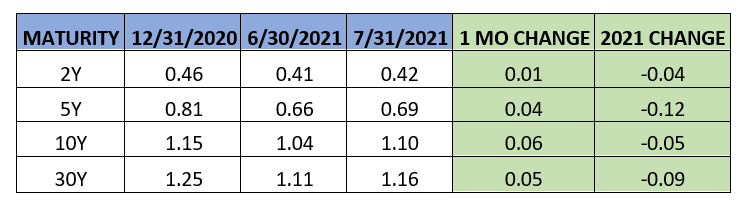
Corporate Bond Spreads Versus Treasuries:
Investment grade corporate bonds rebounded further in July after a challenging start to 2021. Corporate bonds gained 1.42% for the month as measured by LQD, the benchmark iShares Investment Grade Corporate bond ETF. High yield bonds also gained in July overall despite a notable spread widening later in the month as equity markets experienced some volatility.
Despite a strong month of economic data, corporate bond spreads widened slightly in July. Using the 10-year corporate spread as a benchmark, corporate spreads increased from 1.04% to 1.1%. After a slow start to 2021, corporate bond yields remain under control and investors continue to show strong demand for investment-grade corporate paper. In the high yield segment of corporate debt, fears of a protracted economic recovery due to the delta variant caused a notable widening of high yield spreads in the latter half of July. The spread on the ICE BofA U.S. High Yield Index, a commonly used benchmark for the junk bond market, increased to 3.32% by the end of July after almost touching 3% in late June.
Looking at supply, corporations borrowed just $86.4 billion in July, per SIFMA. This amount is almost half the monthly average for 2021 and is surprising given the pace of issuance over the last year. Nonetheless, issuance of corporate bonds in the first half of 2021 reached the second highest level ever over the first six months of any year, only trailing 2020, a record year for corporate bond issuance. Part of the reason for this year’s continued strength is corporate issuance related to the increase in mergers and acquisitions activity, which reached a record in 2020 of $115 billion according to data published by LCD. Sales are projected to be busy heading into the end of the year, as borrowers will likely want to raise funds for refinancing and near-record levels of M&A before the Fed starts to taper asset purchases.