
Fixed Income Market Summary March 2021
Performance Snapshot:
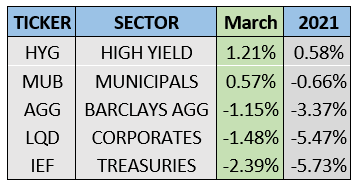
Sector Summary:
US Treasuries: Yields on US Treasuries continued their climb in March, reaching pre-pandemic levels. Positive momentum in economic activity and rising inflation expectations supported the notable increase in yields throughout the quarter. The supply and demand picture for Treasuries appears unfavorable with an infrastructure bill almost certainly forthcoming. The Federal Reserve met in March and reiterated its accommodative policy stance despite growing concerns over inflation.
Municipals: Municipals finished the quarter on a positive note and as the best performing investment grade bond sector, despite a slightly negative return. Municipal yield ratios versus equivalent Treasuries declined back to all-time lows. Investors continued to add money to municipal bond funds with taxes in focus as the next item on President Biden’s agenda.
Corporates: Corporate bond prices slumped again in March, following Treasuries sharply lower throughout the first quarter. Corporate bonds responded mostly to concerns over inflation as spreads versus Treasuries did not change significantly in March. Spreads on longer-term maturities actually tightened slightly during March and throughout Q1 despite the sharp Treasury sell off. We continue to see record issuance in both investment grade and high yield corporate bond markets amid compressed spreads.
TREASURY MARKET OVERVIEW
Yield Summary:
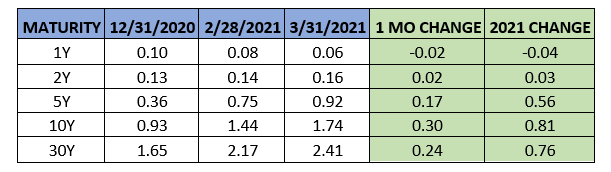
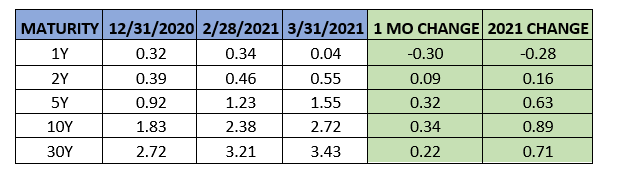
For the first time since the pandemic began, markets witnessed a sustained rise in interest rates. Treasury yields continued their strong upward trend in March, with the benchmark 10-year yield reaching 1.75%, the highest level since January 2020. Treasury yields rose across the entire curve, causing a notable monthly decline in Treasury bond prices. For March, Treasuries declined 2.39% as measured by IEF, the 7-10 Year Treasury ETF. Inflation concerns continue to weigh on Treasuries, as rising market expectations for inflation moved up and Treasury yields followed up in lockstep.
The Federal Reserve Open Market Committee met in March and reiterated its accommodative policy stance in light of subdued inflation data and the committee’s willingness to support the economic recovery. While inflation is making headlines, the March CPI release showed a mild increase in consumer prices and near-term worries have not yet created significant reason for the Fed to act. Nonetheless, FOMC members repeatedly stated that the committee is willing to let inflation run a bit higher than normal due to stubbornly low inflation since the Great Recession and while the Fed is forecasting higher inflation for the remainder of 2021, it believes these increases will be transitory.
Futures on the Federal Funds rate indicate that markets do not expect the Fed to begin raising its key policy rate until early 2023. We believe its important to note that the Fed almost certainly will not raise rates while conducting QE – which is currently happening as the Fed is purchasing $120 billion of Treasuries and mortgage-backed securities per month. This means the central bank would need to announce tapering as soon as late this year to gradually reduce asset purchases if it planned to raise rates in 2022. Given Fed officials’ statements from its last meeting in March, that seems unlikely. Inflation remains tame and the Fed is staying put – at least for now.
With the Fed’s key policy rate expected to stay anchored at 0% and economic data improving, steepening of the Treasury yield curve persisted in March. Using the difference between the yield on the 2-year Treasury and 10-year Treasury as a benchmark, the curve steepened from 1.30% to 1.58% in March. The first yield curve inversion in this cycle from August 2019 is a distant memory at this point. This is the highest monthly close for this spread since the summer of 2015.
In addition to improving economic growth prospects, Treasury issuance is expected to buoy Treasury yields as the market is flooded with supply of new government bonds. Current projections indicate approximately $2 trillion in net Treasury issuance is expected as part of this year’s spending, boosted by pandemic-related fiscal aid and potentially a forthcoming infrastructure package. We expect this Treasury yield curve steepening to continue as monetary and fiscal stimulus from the Fed and Congress supports the economic recovery.
MUNICIPAL MARKET OVERVIEW
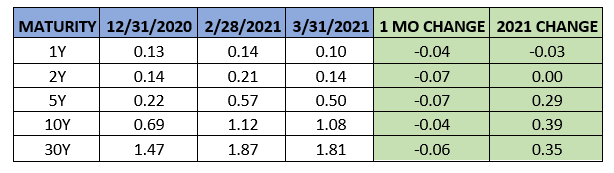
Tax-Exempt Yield Summary:
Tax-Exempt Yields as a Percentage of Treasuries:
Municipal bonds continued to show relative strength, earning a positive return in March while other investment grade fixed income sectors sold off notably. The sector gained 0.57% in March as measured by MUB, the benchmark iShares National Municipal ETF. This wrapped up an interesting quarter for municipal bonds, one in which a majority of fixed income investors felt significant pain due to rising interest rates, both domestically and around the globe. While municipal bond yields rose and bond prices declined overall (around -0.66% per MUB), this is not close to the damage the fixed income market witnessed in Treasuries and corporate bonds. Municipals outperformed each sector by about 5%, which marked the largest outperformance by state and local debt over Treasuries in any quarter since 2009, according to Bloomberg.
On top of the strength displayed last year, municipalities are receiving significant support from the US government under the American Rescue Plan (ARP) signed into law by President Biden on March 11. Under the legislation, state and local governments are set to receive $350 billion of the $1.9 trillion package, which will be earmarked for states to support public health, education, transportation and airline sectors. The impact of this stimulus funding will be felt over a two-year period, as 50% of the funds will be paid within 60 days of enactment and the other 50% no earlier than one year later. According to research published by Moody’s Analytics, if rainy day funds and stimulus received are considered, no aggregate revenue shortfall exists for the states; rather states are projected to have a surplus around $16 billion.
The ARP combined with widespread distribution of the vaccine represents a tailwind for the municipal market as the global economy recovers from the pandemic. As the reopening hopefully progresses and consumer confidence returns, investors’ perception of higher credit quality and lower default risk for the broad municipal bond market will improve. This sentiment is reflected in municipal bond inflows over the last quarter where municipal mutual funds and ETFs pulled in over $26 billion in net flows, according to Lipper.
This strong demand consumed the equally strong new issuance supply in the municipal market in March. Per SIFMA, new issuance for the month totaled $43.1 billion, above the approximate $30 billion monthly average for the first two months of 2021. Overall, state and local governments continue to take advantage of cheap financing due to low interest rates, and Q1 2021 issuance of $102 billion is the largest first quarter issuance since 2015, where the total was $108 billion. Close to 25% of this year’s volume has been taxable, down slightly from 30% for 2020 as Treasury yields have risen sharply amid the improving economic outlook. A new infrastructure bill will certainly alter the landscape for municipal finance, and more specifically taxable municipal issuance, where a portion of the bill could be funded through this market similar to the Build America program in 2009-2010.
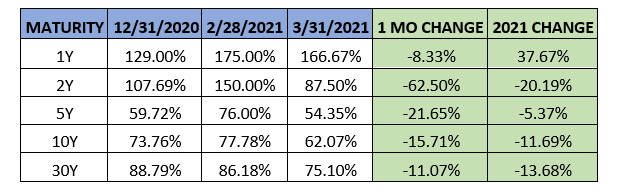
With these market internals supporting the municipal market, the 10-year AAA benchmark declined from 1.12% to 1.08% in March. However, the municipal bond yield curve actually steepened slightly during the month as yields on shorter maturities declined more than longer maturities. Using the difference between the 2-year AAA muni yield and the 10-year muni yield as a benchmark, the municipal yield curve steepened from 0.91% to 0.94%. As municipal yields declined while Treasury yields rose in March, municipal yield ratios retreated back near historic lows. Specifically, 10-year AAA municipal yields decreased from 78% to 62% of the benchmark 10-year Treasury yield. This ratio is well below the long-term average of 80-85%. With tax policy expected to remain in the conversation, we continue to anticipate municipal valuations will remain elevated.
CORPORATE MARKET OVERVIEW
Investment Grade Yield Summary:
Corporate Bond Spreads Versus Treasuries:
Investment grade corporate bonds were not shielded from the struggles that plagued global fixed income markets in March and throughout Q1 2021. After finishing 2020 as the best performing US fixed income sector, corporate bonds fell each month of Q1 2021. Corporate bonds dropped 1.48% in March and have declined 5.47% in 2021 as measured by LQD, the benchmark iShares Investment Grade Corporate Bond ETF. The story was a bit different in high yield bonds, where rising commodity prices and upbeat, risk-on sentiment led to positive outperformance for the sector. Overall, high yield bonds gained 1.21% in March as measured by HYG, the benchmark iShares High Yield Corporate Bond ETF. Historical data shows that in an environment with a steepening Treasury yield curve, high yield bonds tend to outperform.
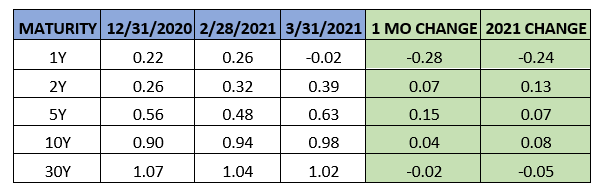
After serving as a significant catalyst for corporate bond performance in 2020, the widening of credit spreads was not to blame for the struggles in this market. Although corporate bonds experienced their worst quarterly loss since 2008, credit spreads on corporate bonds narrowed slightly in Q1 2021. Using the 10-year corporate spread as a benchmark, corporate spreads decreased from 1.04% to 1.02% in March, still hovering near all-time lows.
Despite rising corporate bond yields rising in tandem with Treasuries, the narrowing of spreads indicates demand for corporate debt. On the supply side, corporations borrowed close to $260 billion in March, per SIFMA. This brings the 2021 monthly average near $200 billion per month, slightly above the $190 billion monthly average from 2020, when corporations issued an annual record in debt. The story is similar in high yield bonds, where healthy appetite for speculative credit led to $59.7 billion of issuance in March. This brought the three-month average to $50 billion, and high yield bonds are on pace for $600 billion in issuance this year, which would be the highest annual issuance after 2020 broke that record with $421 billion. We certainly expect the pace to slow, but high yield corporate bond issuance has started off the new year at an impressive clip.