Fixed Income Market Summary—November
US Treasuries – The 10-year treasury reached its peak closing yield thus far in 2018 on November 8. However, ongoing equity market volatility driven by trade concerns, coupled with more dovish language from Fed Chair Jerome Powell reversed the upward trend in interest rates as the month drew to a close. The spread between 2-year and 10-year treasuries reached a new low for 2018, indicating further ambiguity in the short-term direction of interest rates across the curve.
Municipals – Municipals experienced their first positive month since August, and their best performing month since May. Light sales in November, combined with increased demand contributed to performance. Municipal performance continues to be among the best sectors year-to-date, but the sector is becoming expensive relative to comparable Treasuries.
Corporates – Corporate bonds continue to struggle as economic uncertainty looms. Fed warnings regarding levels of corporate debt, especially leveraged loans, contributed to weakness. Headline credit crises created ripple effect in the market as corporate spreads continue to widen to their highest level since 2016.
BOND MARKET PERFORMANCE SNAPSHOT:

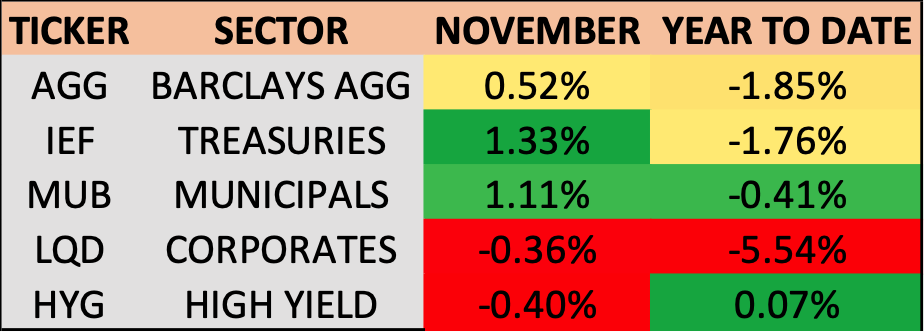
Treasuries and municipals put together a strong November. However, major bond sectors are still down across the board as we approach the end of 2018, shown by the ETFs in the table above. Of the investment grade credits, municipals continue to be the best performer in 2018 after a strong November. High yield and corporates were the only sectors posting negative returns in the month. LQD, the investment grade corporate bond ETF, is on pace for its worst year since opening in 2002, down over 5.5%.
TREASURY MARKET OVERVIEW:
TREASURY YIELD SUMMARY:

The 10-year treasury reached its 2018 peak closing level thus far, finishing November 8th at 3.2373%. This was also the highest closing level since May 2011. Evidently, that was enough to bring buyers back into the market. Consequently, yields plunged through the remainder of November, finishing a tick below 3% for the first time since mid-September. A big contributor to this strength and demand in bonds was continued volatility in the equity markets due to trade concerns. A 6.3% drop in the S&P 500 from November 7-23 buoyed bonds, with Treasuries performing the best during that time frame.
Bonds were also boosted by a change in rhetoric from the Federal Reserve, giving pause to the idea that the Fed might raise rates too aggressively and impede economic growth. In a speech given on November 28, Jerome Powell said that the Fed’s policy rate is “just below” the neutral range, referring to the current 2.125% target rate. He also mentioned that there is no pre-set path for monetary policy and that the Fed will pay close attention to incoming economic data on any rate decision. This contrasts with a speech he made earlier in the month when he said the Fed needed to “think about how much further to raise rates and the pace at which rates should be raised.”
The Fed maintains that monetary policy decisions are based on economic data (not market activity or threats from the President). With recent data weakening, especially in the housing market, many investors interpreted his latest speech as a dovish sign. While the market expectation is for a Fed hike at the December 19th meeting, the market is also assigning a high probability that the Fed will only hike 1-2 times in 2019, when some previous projections were as high as 4.
After a brief period of steepening in October, the Treasury yield curve continued, in November, its pattern of flattening. As shown in the chart above, the belly of the curve, maturities in the 5-10-year range, experienced the largest decline in yields. The 2-10 spread continues to hover around 10 year lows and sits at 0.20% at the end of the month.
Another key development in the Treasury market during November was the decline in real yields, as measured by the difference between the 10-year Treasury yield and the 10-year break-even yield. Real yields had been rising steadily in 2018, reaching their highest level since 2011. Many investors attributed this year’s rise in interest rates to inflation, but the rise in real yields shows that inflations contribution has been overstated. With the recent reversal in several key leading indicators and lower growth expectations, the upward trend in real yields could also shift if the Fed’s dovish tone prevails. Given that part of the Fed’s dual mandate is price stability and keeping inflation under control, this could affect their policy going forward and should be followed closely.
——————————————————————————————————————————-
MUNICIPAL MARKET OVERVIEW:
TAX-EXEMPT MUNICIPAL YIELD SUMMARY:

TAX-EXEMPT MUNICIPAL YIELDS AS A PERCENTAGE OF TREASURY:

Municipal bonds were strong in November, even after the 10-year AAA yield reached its highest level since January 2014 on November 6th. However, after reaching this high, the 10-year yield went down every day for the rest of the month. That’s a streak of 16 consecutive sessions! During these 16 sessions, yields declined over 0.25%. As a result, investment grade municipals experienced their best month since May, gaining about 1.1% as measured by the iShares National Muni Bond ETF (MUB).
Lack of supply was a strong contributor to performance. Municipal bond sales shrank 42% year-over-year to about $24 billion in November, down from the $41.5 billion sold last November. Most of this can be attributed to issuers in 2017 rushing to sell debt as the tax-overhaul bill in Congress threatened to pull subsidies from a big chunk of the market last year. No such market dynamic existed this time around, and a divided Congress lessens the threat of additional tax-reform that could alter the municipal market. Forward-looking supply also paints a good picture for municipals. Similar to November, December forecasts call for issuance of approximately $24.2 billion, far less than the projected $45.8 billion that will come due or be paid in interest during the month.
On the demand side, the story isn’t as black and white. Municipal bond mutual funds experienced outflows in November, continuing a streak that has now reached 10 consecutive weeks. The average outflow during that time was approximately $300 million per week. However, on the ETF side, municipal funds experienced significant inflows in November, totaling almost $1 billion. Municipals had not performed well this year through October. Thus, experts and traders attribute much of this flow data to tax-loss selling of municipal bond mutual funds and swapping them out for municipal ETFs. Of course, this doesn’t account for the entirety of flows, but must be considered when looking at the data this time of year.
In fact, one big buyer entered the municipal market after the Fed’s comments at the end of the month. Following Powell’s speech on November 28, one investor bought $149 million of MUB shares. The purchase caused the fund to see the most share turnover on record with $313.9 million in shares traded that day. Looking into December, Bloomberg projects that $45.8 billion in municipals will come due (mature) or be paid in interest during the month. Given that there is only $24.2 billion projected in supply, demand could be strong the remaining of the year.
From a relative value perspective, the front end of the municipal curve continues to get increasingly expensive versus Treasuries as shown in the table above. The notion of a curve inversion is in full effect for Treasuries; however, there is no sign of inversion in the municipal market. In fact, 10/2 spreads are 37 basis points larger for the municipal curve versus to the treasury curve. In addition, investors aren’t really getting paid to own municipals on that spot of the curve, even from a tax-equivalent yield perspective. More value and better risk-reward can be found in that 7-10-year range, and even further out if investors are willing to extend duration.
Big news in the market also centers around JPMorgan Chase starting up 2 active municipal bond ETF strategies, which have already attracted over $50 million in assets. This continues the trend of active ETFs within this space, where 13 of the 16 ETFs launched since the start of 2017 have been active. Due to their active nature, the funds will have the flexibility to avoid credit issues and won’t simply track an index, as the majority of municipal ETFs do. However, Municipal ETF assets continue to be a small piece of the entire fixed income ETF space. As of the end of October, of the $668 billion invested in fixed income ETFs, about $33 billion was invested in municipals. It’s a growing space and should continue to attract investors if the trend towards active continues. In addition, these active funds and their ability to deviate from an index is valuable in a rising rate environment where fixed income investors are seeking measures to reduce risk.
——————————————————————————————————————————-
CORPORATE MARKET OVERVIEW:
INVESTMENT GRADE CORPORATE YIELD SUMMARY:

CORPORATE BOND SPREADS VERSUS TREASURIES:

Yield changes in the corporate market were mostly muted during November, except on the short end of the curve where near-term economic worries continue to loom large. Corporate bonds did not respond as positively to the Fed and Jerome Powell as other investment grade markets. Corporate performance lagged during November as spreads versus Treasuries widened to their highest level since 2016.
These widening spreads can be largely attributed to the fear of contagion in the corporate market. Crises at companies such as General Electric and California Utility PG&E continue to make headlines and contribute to risk-off sentiment in credit. On November 20th, the benchmark US leveraged loan index saw its largest one-day drop since June 2016 and the US Corporate High-Yield Bond index has fallen to its lowest level since April 2018 as yields reached their highest level in 2 ½ years. These are all further signs that the entirety of the corporate space is struggling and there currently is no real place to hide without taking on significant risk
To add further fuel to that fire, in meeting minutes released on November 29, members of the FOMC expressed concern about the high levels of corporate debt, especially leveraged loans. This came after the Fed’s first ever financial stability report indicated that one of the biggest vulnerabilities in the US financial system is corporate borrowing. The report cited high valuations, investors’ high tolerance for risk taking and historically high levels of corporate debt as a percentage of GDP as reasons for concern.
Of course, there will be pockets of value in the corporate market amidst all these struggles. If Treasuries continue to perform and the Fed soften its tone, the threat of a significant rise in interest rates will subside. Thus, the swelling amount of corporate debt and the ability of these companies to service the debt should strengthen. If these dynamics play out and headline risk dissipates, credit may look better from a valuation perspective and begin to attract a significant number of buyers again.


