

Fixed Income Market Summary October 2019
Performance Snapshot:
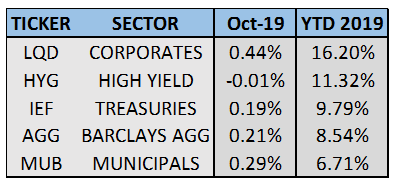
While equities have been strong through October, so too have bonds. In fact, all domestic, investment-grade, fixed income sectors have outperformed the S&P 500 since 10/1/2018.
Sector Summary:
US Treasuries: While US stocks extended their rebound and reached new all-time highs in October, Treasuries continued their strong 2019 and generated positive returns during the month. As anticipated, the Federal Reserve lowered its target interest rate at its October meeting and provided further guidance on projected action for upcoming meetings. As a result, the short-end of the Treasury yield curve dipped significantly in October. The spread between the 2 and 10-year Treasury increased strongly in October, indicating positive sentiment on the global growth front.
Municipals: Municipals generated a positive return in October, bouncing back from a weak September. Municipals with shorter maturities experienced a strong move downward in rates, following the Treasury market as a result of the Federal Reserve rate cut. Thus, the curve steepened throughout the month. Municipal yield ratios versus equivalent Treasuries declined slightly in October, reflected in the marginal outperformance of municipals versus Treasuries. A flood of supply in October could change the supply and demand balance which has been favorable for much of 2019, although investors still have a healthy appetite for tax-free income.
Corporates: Investment-grade corporate bonds gained in October and finished the month as the best performing domestic fixed income sector. High-yield bonds, on the other hand, finished just about flat, down 0.01%. Corporate bond spreads versus equivalent US Treasuries declined further in October, highlighting the strong performance of the sector. Headline risk continues to loom but has yet to cause a prolonged period of weakness in the corporate space. However, fear regarding the debt of energy companies is an issue gaining significant attention.
———————————————————————————————————————
TREASURY MARKET OVERVIEW
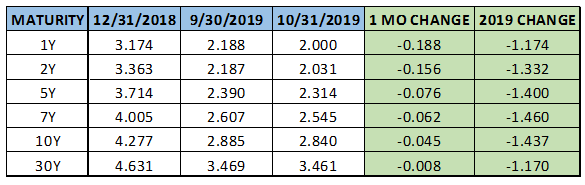
Yield Summary:
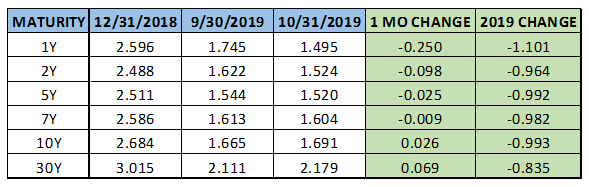
Treasury prices bounced back in October, as investors continued to balance upbeat news from trade negotiations, middle of the road economic data and recently, an accommodative Federal Reserve. The 10-year Treasury yield opened the month at 1.67% and immediately declined to 1.53% by October 4 after employment and wage growth data showed a softening labor market in the month prior. From there, positive headlines on the US-China trade front sent yields above 1.8%. Finally, dovish rhetoric from the Fed brought the benchmark yield back down where it closed the month at 1.69%. This is just about 100 basis points below where the 10-year Treasury yield sat on December 31, 2018.
The Federal Reserve’s Open Market Committee met on October 30th and as expected, cut its benchmark interest rate for the third straight meeting. The Committee noted that risks to the economy had “subsided” since its last meeting in September. Fed Chair Powell highlighted the consumer’s strength and resilience. However, persistent manufacturing weakness remains a concern. The Committee indicated that it would require a material reassessment of its outlook in order to change its policy rate path. Therefore, it appears the path forward will be neutral for the next few meetings based on the interest rate futures market, which projects the next cut at the May 2020 policy meeting. As always, geopolitical developments and economic data can change these projections quite quickly.
The Treasury yield curve steepened quite markedly during October. After sitting at 4 basis points at the end of September the 2-10 Treasury yield spread increased to 17 basis points by October 31. Much of this can be attributed to the action from the Federal Reserve, which caused Treasuries with shorter maturities to decline sharply in yield. Further evidence of steepening can be observed in the 2-5 spread, which after being negative since July, finished October at 0.With the Fed set to pause, improving data could increase the steepening effect and will be something to keep an eye on going forward.
———————————————————————————————————————
MUNICIPAL MARKET OVERVIEW:
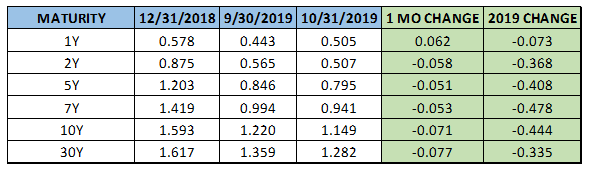
TAX-EXEMPT YIELD SUMMARY:
TAX-EXEMPT YIELDS AS A PERCENTAGE OF TREASURIES:
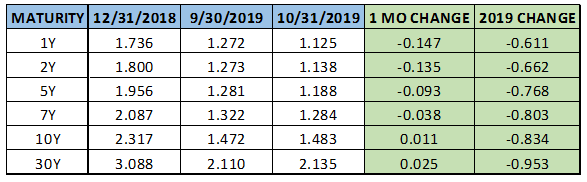
Municipals gained in October, rebounding from their first negative month in 2019 during September. As with Treasuries, the long end of the curve was mostly unchanged while municipals with shorter maturities experienced a noticeable decline in yield. Overall, the 10-year AAA municipal benchmark yield inched up to 1.48%, just 22 basis points above its all-time low reached in August.
The story of 2019 in the municipal market is the continued strong demand from investors seeking tax-free income. During October, municipal bond mutual funds experienced the 42nd consecutive week of inflows according to the Investment Company Institute. This sector has yet to post a single outflow for any given week in 2019.
On the supply side, seasonal increases in issuance in October did not slow down the sector. Over $47 billion of debt sales occurred during October, the busiest month since October 2016, when issuers sold $52 billion worth of bonds. Borrowing costs have fallen so much that issuers can even refinance tax-exempt debt with what are usually higher-yielding taxable securities and still come out ahead. According to Bloomberg, this has accounted for much of the surge in issuance that occurred in September and October.
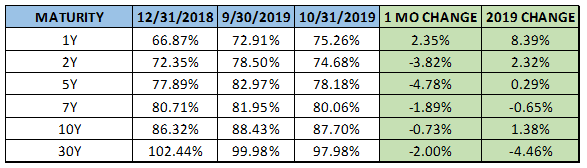
In October, while municipal bonds became slightly more expensive when compared to yields of equivalent Treasuries, they are still trading at more favorable ratios than during the third quarter. Specifically, the 2-year municipal AAA yields are now 75% of the 2-year Treasury yield, well above the 60% ratio where it stood in July 2019. In addition, the 10-year municipal AAA yield was unchanged at 88% of the 10-year Treasury yield, well above the 76% at the July close. As has been the case for much of the year, the tax-equivalent yield of bonds in the intermediate-long portion of the curve continue to offer favorable yield on a relative basis versus shorter maturities.
The municipal yield curve steepened in October largely due to the Fed rate decision. Just as ratios are more favorable on the intermediate part of the curve, the spreads throughout the municipal yield curve indicate favorable steepness versus Treasuries. The 2-10 spread in municipals increased to 35 basis points in October, with the same spread being about 17 basis points for Treasuries. In addition, the 2-30 spread in municipals is still 35 basis points larger than Treasuries. Investors in higher tax brackets seeking income can continue to earn higher-tax equivalent returns on tax-free municipals.
Another area where investors are trying to uncover value is the taxable municipal market. Taxable municipal issuance surged in 2019 to $50 billion, a 49% increase from the same time last year. Wider spreads can be uncovered in this market that has approximately $500 billion in bonds. In fact, taxable municipal revenue bonds maturing in 10 years have 27 basis points more spread over an equivalent US Treasury than AA-rated corporate bonds, according to Bloomberg.
———————————————————————————————————————
CORPORATE MARKET OVERVIEW:
INVESTMENT GRADE YIELD SUMMARY:
CORPORATE BOND SPREADS VERSUS TREASURIES:
Investment-grade corporates led the way in October, posting a 0.44% gain as measured by LQD, the corporate bond index ETF. Corporates continue to lead all domestic fixed income sectors in 2019 and are on pace for their best year since 2009. High-yield bonds have slowed in recent months and finished October virtually flat while remaining very close to its all-time high.
Much of the gain in October can be attributed to the continued tightening of corporate bond spreads versus equivalent Treasuries. Using the 10-year corporate spread as a benchmark, the spread finished October at 115 basis points, well below 159 basis points where it closed 2018. 115 basis points are approaching the YTD low for 2019. This spread tightening is among the mixed economic and market data points that point to economic strength and, moreover, reflects investors’ appetite for risk and the relentless global search for yield.
A story that is gaining attention in the corporate bond market is that investors are becoming increasingly concerned with the debt issued by blue-chip energy companies. The energy sector is the worst performer this year, gaining 3.72%, while the S&P 500 is up about 23%. Over the last year, the sector is down 10.6%. While concerns over the stock performance of energy companies are obvious, debt holders are starting to take notice.
As a result, low stock market valuations of big energy companies could force these firms to borrow money at an even higher rate than they currently are. According to strategists from Barclays, if these companies don’t pay down debt and continue lagging in the stock market, their credit ratings could come under pressure. Barclays points specifically to the ratio of debt to an enterprise value of these companies. Historically, when this ratio increases to 50% or greater, the chance of a company losing its investment-grade rating increases dramatically. Simply put, lower valuations reflect concerns about future creditworthiness and several big names in the sector are at or above that 50% ratio. This is certainly something to keep an eye on for the energy sector which makes up between 10-20% of investment-grade corporate and high-yield markets respectively.