
Fixed Income Market Summary October 2020
Performance Snapshot:
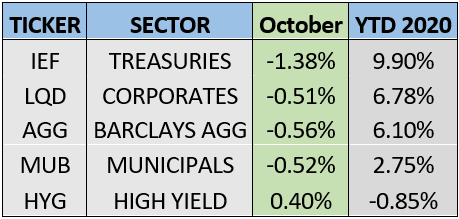
Sector Summary:
US Treasuries: Treasury prices declined notably in October as the prospect of additional fiscal stimulus caused interest rates to rise sharply. This happened while global equity markets suffered a second straight monthly decline. The Federal Reserve Open Market Committee did not meet in October and we expect further insights from the committee about the course of monetary policy at its final meeting in 2020 scheduled for December. Economic data continued to rebound and show improvement, with the Q3 2020 GDP release garnering significant attention.
Municipals: Municipals followed Treasuries lower in October as yields rose. Both issuance and demand for municipals maintained strength which is expected to continue into year end. Municipal yield ratios declined in October, indicating an increase in relative valuation in the sector. With taxes in focus after the election, municipals remain attractive for the highest earners with the potential for additional benefits if tax legislation is passed. A package of additional aid to state and local government is still on hold, causing additional concern as the Municipal Credit Facility from the Federal Reserve is set to expire at the end of the year.
Corporates: Corporate bond prices were mixed in October, with investment grade issues declining and high yield bond surprisingly posting positive returns during the month. Corporate bonds still outperformed expectations with corporate spreads tightening notably with the release of improving economic data. Increased equity market volatility and the threat of additional lockdowns caused investors to withdraw money from high yield funds at the end of October despite a strong month.
————————————————————————————————————————
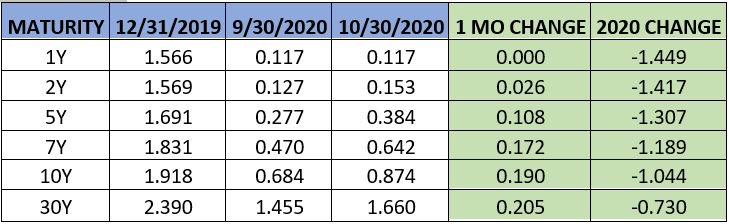
TREASURY MARKET OVERVIEW
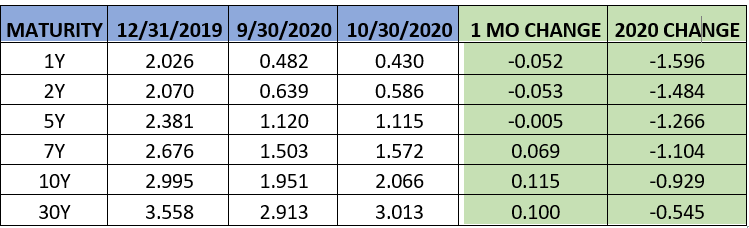
Yield Summary:
Equity markets were on uneven footing for most of October, posting a second consecutive monthly drop. The S&P 500 ended October by posting its worst week since March, falling 5.6% to ultimately close down 2.5% for the month. This volatility occurred while economic data showed notable improvement. Retail sales increased and the US unemployment rate declined, both for the 5th straight month. US Q3 GDP growth posted the highest reading since World War 2, a 33.1% annualized rate, in a further rebound from the depths of the recession in Q2. The US economy has now recovered about two-thirds of the growth it lost during the pandemic, but analysts still project the economy will end 2020 smaller than a year earlier.
With these data releases and market activity, Treasuries were not necessarily a place to hide in October with increased odds of a victory for Joe Biden contributing to Treasury weakness. The anticipation of sizeable fiscal stimulus in the form of additional pandemic aid and infrastructure spending under a Biden administration caused a sharp increase in Treasury yields. This sentiment was further substantiated by a recent report published by the Treasury summarizing its past and future borrowing expectations. From July-September 2020, the Treasury borrowed $454 billion and is expected to borrow $617 billion from October-December. The Treasury projects this figure to balloon to $1.127 trillion, almost three times the Q3 2020 number. While this projection almost certainly hinges on legislative approval, this seems to be the ideal runway for a modest increase in Treasury yields through the first quarter of 2021.
Treasuries declined 1.38% in October, as measured by IEF (7-10 Year Treasury ETF), but are still the leading performer among domestic fixed income sectors in 2020 with gains near 10%. The benchmark 10-year Treasury yield increased 0.19%, its largest monthly increase this year. This also led to the highest monthly close for the benchmark yield since February at 0.87%.
The Federal Reserve Open Market Committee is set to meet in early November and is not expected to offer any significant insights into future monetary policy plans with the election result shifting financial markets and near-term expectations. The committee is scheduled to meet in December, the last meeting in 2020 where a post meeting press conference should further clarify its policy and outlook heading into 2021.
With the Fed on hold and longer-term Treasury yields increasing with the prospect of massive fiscal stimulus, the Treasury yield curve steepened to its highest level since June. Using the difference between the yield on the 2-year Treasury and 10-year Treasury as a benchmark, the curve steepened from 0.56% to 0.72%, the largest monthly increase since March when the Fed slashed rates back to zero. Given that we do not expect the Fed to change course, the steepness of the curve will continue to depend on a combination of improving growth prospects and the passage of fiscal stimulus – both of which affect longer-term interest rates.
————————————————————————————————————————
MUNICIPAL MARKET OVERVIEW
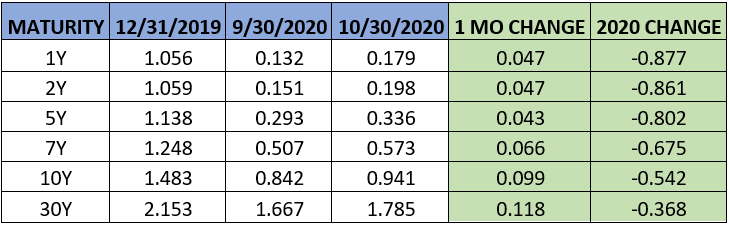
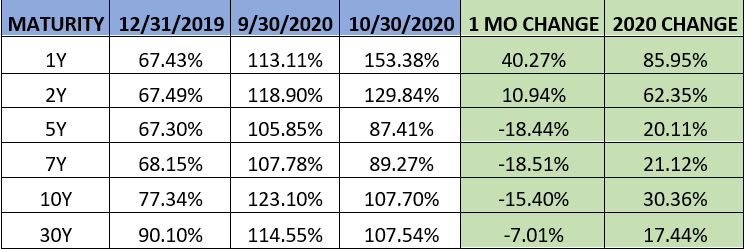
Tax-Exempt Yields as a Percentage of Treasuries:
Municipal bonds declined in October, following the lead of US Treasuries as interest rates increased across all investment-grade fixed income sectors. Municipals delivered negative returns of -0.52% as measured by MUB, the iShares National Municipal Bond ETF. The 10-year AAA municipal benchmark yield increased notably to 0.94%, the highest close to end a month since April.
The continued relative strength of the municipal market in October can be attributed to consistent inflows into municipal bond funds. Investors added $582 million to municipal bond mutual funds for the week ended 10/28, extending a six month streak of weekly inflows. However, the average monthly inflow decreased in October below $1 billion as municipal investors awaited more clarity from the US Presidential election.
On the supply side, state and local governments unleased a record-setting flood of bond sales last month. Racing to lock-in low interest rates and take advantage of the relative calm in credit markets ahead of the election, municipalities issued $71.4 billion of debt in October. This is 22% more than the previous record in December 2017, when governments hurried to borrow before pending legislation that ended tax-exemption for advance refunding issues. Per SIFMA, this brings total municipal issuance to $420.5 billion in 2020, a 25% increase from the same time last year. The annual record of municipal issuance is $452 billion in 2016, which will undoubtedly be reached by year-end, barring a widespread seizure of credit markets.
Over a third of issuance in October was of the taxable variety, which is also approaching an annual record of issuance. The largest annual issuance of taxable municipal bonds was $151.1 billion in 2010, most of which was part of the Build America Program that was implemented to stem the fallout from the Great Financial Crisis in 2008-09. To provide further context, in the nine full years since that program ended, the average taxable municipal issuance was roughly $30 billion per year. This growing market is gathering attention for its relative value and historically better credit versus investment grade corporate bonds.
Market activity and expectations of additional fiscal stimulus caused the municipal yield curve to steepen during the month. Using the spread between the 2-year AAA yield and 10-year AAA yield, spreads increased from 0.69% to 0.74%. Short-term municipal yields increased notably versus their US Treasury counterparts, driving ratios up. State and local governments rushing to get deals done for near-term funding needs prior to the election are partly to blame for this relative increase. On the longer end, the 10-year AAA muni/TSY ratio closed the month at 108%, a significant decline from last month’s close of 123%. Both benchmark yields increased sharply in October, but Treasury yields increased more on the long end with the projections of Treasury issuance to cover the still disputed additional pandemic aid package. This ratio has averaged 80-85% historically, so municipals are still relatively cheap versus Treasuries on the long-end of the yield curve.
As Congress continues to debate the next pandemic aid package, state and local governments are watching closely to see what assistance they may or may not receive. The Federal Reserve’s Municipal Liquidity Facility is scheduled to expire on December 31. Created under the CARES Act when the total market froze back in March, the criticized and thus far seldom-used MLF operates as a backstop to the municipal market. In essence, the program offers short-term loans at premium prices and serves as an important emergency funding source. With the pandemic expected to continue well into 2021, municipal investors will eagerly await the Fed and Treasury decision regarding the extension of this program as a last resort for municipalities that may get further squeezed by the economic slowdown.
————————————————————————————————————————
CORPORATE MARKET OVERVIEW
Investment Grade Yield Summary:
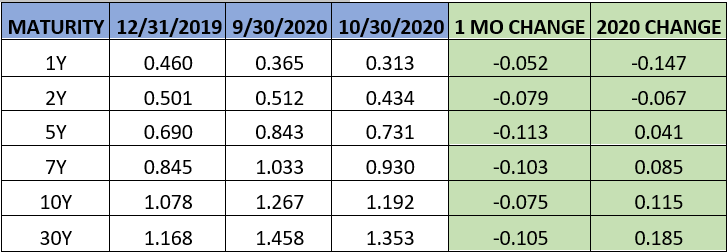
Corporate Bond Spreads Versus Treasuries:
Corporate bonds were mixed during October as equities and Treasuries both sold off. Corporate bonds declined 0.51% for the month, as measured by LQD, the iShares Investment Grade Corporate Bond ETF. High-yield bonds, on the other hand, posted a surprising gain in October even with risk assets and bonds both showing weakness. High yield was the only positive sector during the month, returning 0.4%, but is also the only domestic fixed income sector that has posted negative returns in 2020. Overall, investment grade corporate bonds are the best performing credit sector this year, also outperforming the AGG.
Despite negative returns and equity market volatility, credit spreads tightened across the yield curve in October with improving economic data temporarily outweighing market concerns in the eyes of investors. Using the 10-year corporate spread as a benchmark, corporate spreads tightened about 8 basis points to 1.19%. This happened after the benchmark spread closed September at its highest closing level in 3 months. The benchmark spread finished October just below half of the level (2.45%) where it closed in March after the Federal Reserve’s implementation of credit and liquidity facilities. The tightening of spreads indicates improving economic and credit conditions despite the rocky month for global equities, a positive sign for corporations looking to borrow.
Per SIFMA, corporations borrowed $123.5 billion in October, a light month compared to the extreme borrowing we have witnessed in 2020. The average monthly issuance of corporate bonds was $216.7 billion in the first nine months of the year. Year to date issuance continues to forge a new annual record, now over $2 trillion, a 66% increase from January to October 2019. In the high yield subset of corporate bonds, issuance for October was $33.7 billion, which pushed the total for 2020 to a record $358.5 billion. This number eclipses the previous record of $332 billion in 2013. On the demand side, the last week of October saw high yield bond funds suffer the biggest outflows in over a month as investors sought to limit their exposure amid rising COVID-19 cases and heading into the US Presidential election. The rising odds of a Biden presidency helped offset concerns about the passage of a fiscal stimulus package, leaving investors comfortable to add cyclical exposures and back off of lower quality debt. However, there is concern that the disputed presidential election could notably increase high yield spreads, which are already running below long-term levels.