
Fixed Income Market Summary June 2020
Performance Snapshot:
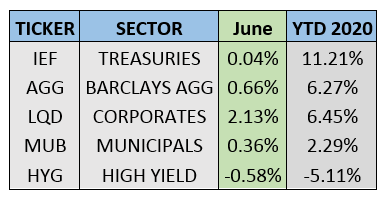
Sector Summary:
US Treasuries: Treasuries provided ballast when equities were on unequal footing throughout early June, before the S&P 500 eventually finished in positive territory. Treasuries ended the first half of 2020 with a virtually flat month, but were the leading sector throughout the volatile 6 months. Treasury yields barely moved in June, with just the shorter maturities reaching new lows. The Federal Reserve Open Market Committee met in mid-June, reiterating an accommodative policy stance and continued zero interest rate policy (ZIRP).
Municipals: Municipals continued their recovery in June, posting another monthly gain after a very strong May. Positive sentiment and flows backed up this strength, but reopening concerns continue to weigh on certain sectors of the municipal market. Municipal yields on short-term debt rose causing a shift in ratios versus Treasuries on these maturities. As state and local governments seek liquidity, refunding and taxable municipal issuance increased significantly in 2020.
Corporates: Corporate bonds continued their sharp ascent, finishing the quarter with another 2% monthly gain. High-yield bonds, in contrast, experienced a loss during the month that also included significant investor outflows. Fed influence continues to be a significant factor in the corporate bond market. Massive corporate issuance reached new record levels, but corporate bond yields still managed to reach new all-time lows in June. Credit concerns persist in several sectors of the corporate market.
——————————————————————————————————————————-
TREASURY MARKET OVERVIEW
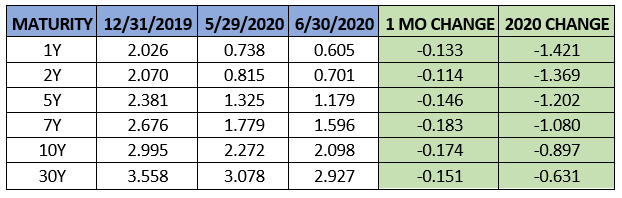
Yield Summary:
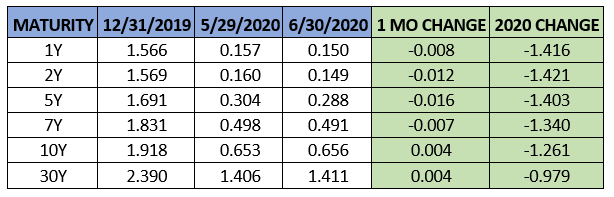
While economic data showed some improvement in June, equity markets exhibited the most volatility since late March. A late-month surge brought the S&P 500 to a 1.8% gain for June, but not before several bumps in the road. These included a 6% drop on June 11 after the Federal Reserve expressed significant concerns in its global economic and growth outlook. During these swift and abrupt drops, Treasuries provided ballast despite their extremely low yields. For the month, Treasuries finished just about flat, generating a return of 0.04% as measured by IEF (7-10 Year Treasury ETF). This wrapped up the best first half for Treasuries since 1995.
For Q2 2020, the 10-year Treasury barely moved, opening in April at 0.67% and closing June at 0.66%. For much of the quarter the yield bounced between 0.6% and 0.75%. In addition, the 2, 5 and 7-year Treasuries finished June with the lowest monthly closing yields of all-time. Meanwhile, global equities shrugged off the gloomy economic outlook and the S&P 500 gained 20%, while IEF also gained 0.65%. Fed stimulus is certainly a factor, but the lack of upward momentum in yields still indicate investors’ cautious attitude despite the strong equity rally.
The Federal Reserve Open Market Committee met on June 9-10 and left its benchmark interest rate unchanged. The committee indicated the need for highly accommodative policy ahead and it “was not even thinking of thinking about raising rates.” The Fed’s ZIRP is the expectation for the foreseeable future and the committee offered an unfavorable outlook for the global economy, which rattled markets. Members of the committee also discussed the idea of capping bond yields, but the implementation of such a policy was not completely clear.
With all this happening, the Fed Balance sheet decreased in size, albeit slightly, to close out the quarter. The size of the balance sheet peaked the week of June 10 at approximately $7.17 trillion and closed June at $7.01 trillion. The balance sheet began 2020 around $4 trillion so this reduction is minimal by comparison. However, this will certainly be something to watch if the trend continues as much of the global risk asset rally has been driven by a record explosion in central bank liquidity.
The Treasury yield curve steepened sharply after the Fed cut interest rates in March. This is apparent by looking specifically at the spread between the 2 and 10-year Treasuries, which is now 51 basis points after the yield curve inverted in February. Despite the low yields, flows into ETFs that own government bonds were strong throughout most of Q2 as investors sought safety after March’s extreme volatility. However, in June government bond ETFs experienced a small outflow for the first month in 2020. Another noteworthy observation from June ETF data was the outflows from ultra-short and short-term government funds and in favor of funds with bonds of longer maturities. As the equity rally continued through most of the quarter, investors still sought safety in Treasuries, but turned up duration slightly to better balance the potential for wild equity market swings that occurred in much of February and March.
———————————————————————————————————————
MUNICIPAL MARKET OVERVIEW
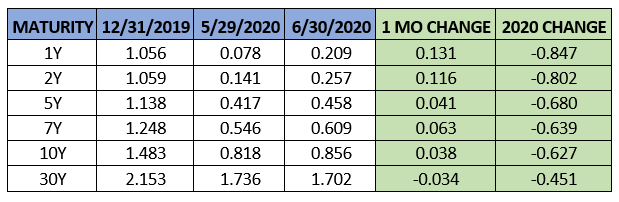
Tax-Exempt Yield Summary:
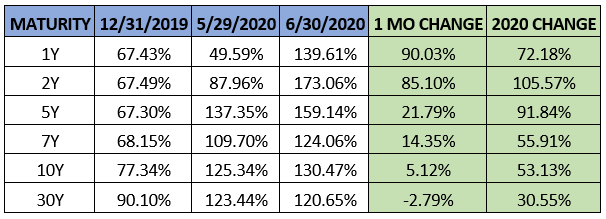
Tax-Exempt Yields as a Percentage of Treasuries:
Municipal bonds finished off a strong quarter with another positive month, gaining 0.36% as measured by MUB – the iShares National Municipal Bond ETF. Renewed confidence in the ability of state and local governments to cover their debt obligations was evidenced by four consecutive weeks of strong inflows into municipal bond mutual funds in June. The last two weeks of June saw inflows of $1.7 billion and $1.5 billion, respectively, right around the average of the impressive 60-week streak of inflows that ended in early March. The municipal market is on much firmer footing at the end of this quarter versus Q1 2020 when fear in this market recently peaked.
Despite the temporary calm in the markets, cities and states are seeking additional help from Congress. According to a recent survey by the National League of Cities, 65% of the 1100 municipalities surveyed have been forced to delay or cancel infrastructure projects and capital expenditures because of the pandemic’s toll on local government finances. The same survey indicated that a third of cities will have to furlough or lay off more municipal workers, adding to the 1.5 million public sector jobs already lost since March. While many municipalities built up adequate reserves during the economic expansion of the 2010s, projections of budget shortfalls for states alone may reach $615 billion over the next 3 years, according to the Center on Budget and Policy Priorities. The picture continues to look murky for municipal finance, although certain areas of the market, such as non-essential services, will continue to feel outsized effects from this economic fallout.
In the face of these hardships, municipal bond issuance returned to typical levels after a temporary freeze in March. Per SIFMA, municipalities issued $48.6 billion of bonds in June, the largest monthly issuance in 2020. This brought total issuance in the first half of 2020 to $201.5 billion, an increase of 16.3% versus the same time frame in 2019.
A notable development in the municipal market is the sharp increase in issuance of taxable bonds, which has totaled $50.6 billion year to date. This number is almost four times the taxable municipal issuance at the same point last year and fast approaching the total taxable issuance in 2019 ($67.3 billion). With the Fed intervening in the corporate market and pushing corporate yields very low, taxable municipal bonds offer a yield premium over corporates with better credits, as municipals have historically lower default rates. There is significant value in this overlooked market that has grown noticeably this year.
On the tax-exempt portion of the municipal market, yields on AAA municipals maturing in 1-year increased to 0.21% in June after plunging to 0.08% in May. Short-term securities have specifically benefited from two Federal Reserve programs aimed at municipal debt, including one that could lend as much as $500 billion to governments facing budget shortfalls. This brought yield ratios on short-term municipals back above 100% after finishing May at 50%.
This movement in yields also caused the municipal yield curve to flatten. Using the spread between the 2-year yield and the 10-year yield, spreads narrowed from 0.68% to 0.60%. The 10-year AAA muni/TSY ratio closed the month at 130%, a slight change from last month’s close of 125%. The long-term historical average for this ratio is about 80-85%, so municipals still may have room to run with ratios above 100% across the curve.
———————————————————————————————————————
CORPORATE MARKET OVERVIEW
Investment Grade Yield Summary:
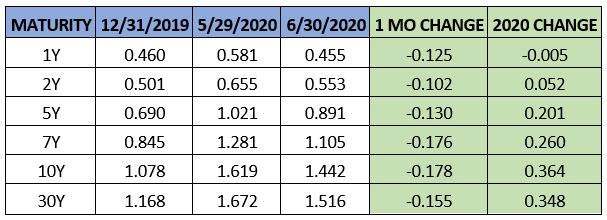
Corporate Bond Spreads Versus Treasuries:
Investment grade corporate bonds continued their blistering pace in June, wrapping up a very strong quarter. High yield bonds, however, stumbled towards the end of the month as credit concerns mounted and investor sentiment shifted. Corporate bonds finished the quarter up 9.71%, as measured by the benchmark ETF LQD. Despite a negative June, high-yield bonds still returned 7.34% in Q2.
Tightening spreads were a main reason for the strong performance. Using the 10-year corporate spread to Treasury as a benchmark, corporate spreads tightened 18 basis points in June. The spread sits at 144 basis points, below the 400 basis points it reached during the height of the uncertainty in March, but above the 108 basis points where it began this year.
After initiating its corporate bond purchase program by purchasing corporate bond ETFs in May, the Federal Reserve expanded the scope of this program in June to include individual corporate bonds. As of the end of the month, Fed filings showed that purchases totaled $430 million of individual bonds and $6.8 billion in ETFs. For a market with $10 trillion, including $961 billion in ETFs, this is certainly a small piece of the pie. The corporate credit lending facility currently allows up to $750 billion, so even at max capacity it would not be a significant portion of the corporate bond market. While the Fed’s support of the market is making corporate bonds seem like a low-risk investment and has brought yields to all-time lows, this offers some perspective on how much the central bank is truly intervening.
Corporate bond issuance for June finished at $235.4 billion, the lowest month since February. However, this issuance was larger than any month in 2019. This brought total corporate bond issuance for 2020 to $1.42 trillion, a 94% increase versus the same time in 2019, per SIFMA. The story is the same in high yield bonds, where monthly issuance in June eclipsed $55 billion, the highest monthly reading on record.
Of interest in investment grade corporate bond issuance is the massive spike in issuance to specifically refinance short-term bonds known as commercial paper. This type of issuance reached $100 billion in June, the by far the highest number in the last 30 years. For context, this number was about $60 billion at the height of the Financial Crisis in 2008. With long-term rates reaching new historic lows, companies are doing their best to take advantage by lowering debt servicing costs of their current debt outstanding.
While a significant portion of the liquidity from central banks has made its way into corporate and high-yield bonds, we continue to be cautious of credits in these areas. Fed ownership and asset price support is not the same as credit worthiness. According to S&P Global Ratings, bond defaults in 2020 have totaled 109, almost matching the total for all of 2019. Of these defaults, 18 occurred in the energy sector, which saw only 20 defaults in all of 2019.
Performance in high yield bonds was strong in Q2 but investors began to heed this warning at the end of the quarter. According to Lipper, investors pulled $5.55 billion from high-yield mutual funds in the last week of June, the fourth largest withdrawal on record. While this can certainly be attributed to investors taking profit after a snapback in high-yield prices this quarter, we believe there could be something additional brewing below the surface. Investors must really proceed with caution when it comes to owning high-yield, and even corporate bonds given the state of the economy.