
Fixed Income Market Summary May 2020
Performance Snapshot:
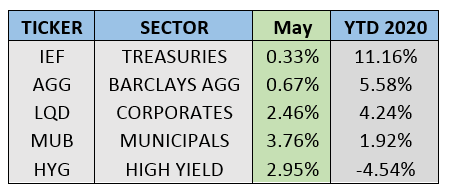
Sector Summary:
US Treasuries: Financial markets continued their spectacular recoveries in May, with the S&P rising almost 5%. This risk-on sentiment grew despite soft economic growth data. Treasury yields barely budged, with new lows reached on shorter maturities. Federal Reserve stimulus and Treasury issuance reached record levels, with the sale of 20-year bonds for the first time since 1984. The next round of guidance from the Federal Reserve will come after its Open Market Committee meetings June 9th and 10th.
Municipals: Municipals recovered from a weak April with the sector experiencing its best monthly gain since 2009. A new streak of weekly inflows to municipal bond funds spanned the entire month of May. States began to slowly reopen and the uptick in economic activity renewed confidence in the creditworthiness of the debt issued by state and local governments. Healthy new issuance continued, but it is the favorable seasonality and supply dynamics that hint at continued strength. The municipal yield curve steepened sharply as yields on shorter maturities declined considerably more than yields on longer maturities, shaking up yield ratios versus Treasuries.
Corporates: Corporate and high yield bonds benefited from the risk-on investor sentiment and achieved strong returns. Once again, the Fed helped by providing market support when it initiated the purchase of corporate bonds and ETFs. Corporate spreads continued to tighten, but still remain relatively elevated versus the beginning of the year. Corporations continued record issuance of debt as they attempt to weather the COVID-19-induced extended slump in economic activity. Potential downgrades of corporate bonds reached an all-time high in May.
——————————————————————————————————————————-
TREASURY MARKET OVERVIEW
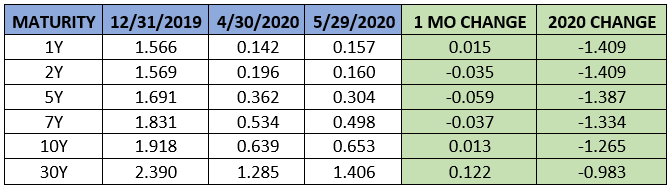
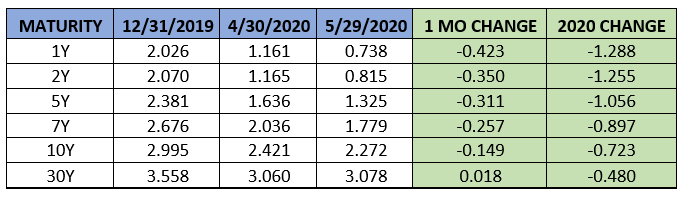
Yield Summary:
In May, financial markets extended their recovery from a disastrous first quarter. While there remains plenty of uncertainty, the equity markets brushed most of that aside, instead betting that the economy will quickly rebound as it awakens from its slumber. The S&P 500 rose 18% in the first two months of Q2 2020 April and May. The Treasury market also worked through the initial shock of an economic shut down and posted a positive month in May. As measured by IEF (7-10-year Treasury ETF), Treasuries gained 0.33%, bringing year-to date returns over 11%.
As bond yields stay range-bound, the bond market is sending a slightly different signal than the stock market. Despite the surge in equities, the 10-year Treasury yield has stayed between 0.6% and 0.8% over the last 2 months. The 5-year Treasury yield closed May 2020 at an all-time low of 0.3%. The 2-year Treasury yield also closed May at an all-time low of 0.16%.
The latter data point continues to be watched closely as whispers have emerged suggesting the Federal Reserve may pursue a negative interest rate policy. The central bank acted quickly at the onset of the pandemic, and its massive policy answer stabilized financial markets effectively. To put the magnitude of current Fed stimulus into perspective, the balance sheet has expanded to over $7 trillion, after hovering around $4 trillion for most of the last 6 years. That amounts to a 75% increase in just over 2 months! This amount of stimulus already eclipses the total value of securities bought in each of the three Quantitative Easing programs enacted to pull the country out of the 2008 financial crisis.
To be clear, we do not expect a negative interest rate policy to be necessary. However, as we look at trading in the futures market, market participants are pricing in a negative Fed Funds rate in mid to late 2021. Although sentiment has improved and optimism abounds, we would not put anything past the Fed if this rebound reverses course. We will get more guidance from the committee after their meeting on June 9-10.
Fiscal stimulus in the form of Treasury issuance is expected to remain strong to combat the slowdown in economic activity. According to the US Treasury, approximately $700 billion of Treasury bonds is projected to be issued in Q3 2020, after $3 trillion in Q2. The Q3 figure alone would surpass the previous high reached in Q3 2008. While a considerable amount of issuance is in shorter-term maturities to fund ongoing operations, on May 20 the Treasury held its first auction of 20-year debt since 1986. Market participants met this auction with strong demand, and the newly issued debt is expected to improve liquidity for older long-term Treasuries, a lingering issue since mid-March, when trading of these longer maturities seized up.
Economic data does not seem to indicate overheating inflation, even as oil prices rebounded strongly during May. Continued momentum and increases in economic demand, along with healthy issuance of longer-term securities could put upward pressure on longer-term interest rates over the next few months. This would further steepen the Treasury yield curve, which has already steepened considerably as a consequence of Fed stimulus.
———————————————————————————————————————
MUNICIPAL MARKET OVERVIEW
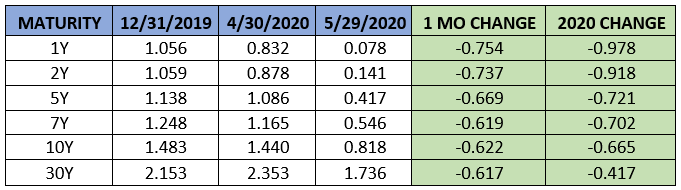
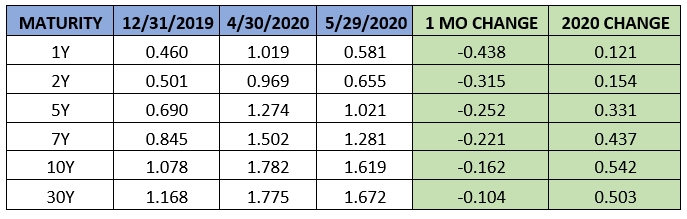
Tax-Exempt Yield Summary:
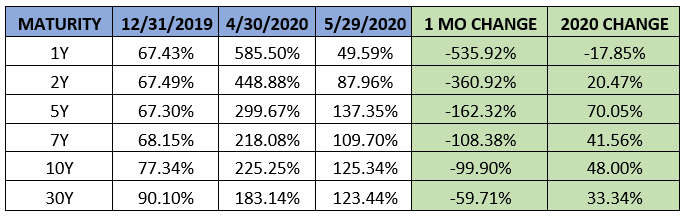
Tax-Exempt Yields as a Percentage of Treasuries
After finishing April as the only major fixed income sector with negative returns, municipals rallied strongly in May. The sector gained 3.76% as measured by MUB – the iShares National Municipal Bond ETF. This was the largest monthly gain since 2009 and returned municipals to positive territory in 2020. States and cities slowly initiated the economic reopening process, a process that is important to allaying concerns about the ability of municipalities to cover their debt obligations and reducing borrowing costs sharply.
Investor demand returned as the sector saw strong inflows into municipal bond mutual funds in late April and throughout May. This occurred after choppy flows over the previous 6 weeks due to economic uncertainty. For the week ended May 27, inflows totaled $1.65 billion according to the Investment Company Institute. The 60-week streak of inflows that ended in early March averaged approximately $1.5 billion per week, so inflows have returned to a healthy clip despite low nominal yields.
On the supply side, new municipal bond sales in May totaled $29.2 billion. Despite weak issuance in March due to surging borrowing costs, there has still been $151.7 billion through the first 4 months of 2020. Per SIFMA, this is an 11% increase through the same period in 2019. This is a good sign as the market heads towards the summer months which typically is soft as many cities begin their fiscal year.
Any new issuance is expected to be met with strong demand. According to Bloomberg, principal and interest payments that municipal investors will receive over the next three months is expected to exceed new amount of bonds sold by $52 billion. In addition, recent SEC filings at the end of March indicate that some of the largest US banks increased their holdings of municipal bonds during Q1 2020 when the wave of selling caused municipal prices to drop the most in 40 years. JP Morgan increased its muni holdings for the first time since 2017 and Citigroup added $1.3 billion to municipal bonds, leading the way among domestic financial institutions.
The healthy demand for municipals from a growing and diverse group of buyers drove yields down across the curve, and yields on shorter-term debt near zero. Yields on AAA municipals maturing in 1-year closed May at 0.08%, after surging to 2.8% in late March. Short-term securities have specifically benefited from two Federal Reserve programs aimed at municipal debt, including one that could lend as much as $500 billion to governments facing budget shortfalls.
This movement in yields caused the municipal yield curve to steepen. Using the spread between the 2-year yield and the 10-year yield, spreads widened from 0.56% to 0.68%. More importantly, however, it dramatically changed the ratio of yields on municipal bonds versus US Treasuries. The 10-year AAA muni/TSY ratio closed the month at 125% as municipal yields tightened, down from 225% a month ago. The long-term historical average for this ratio is about 80-85%, so municipals still may have a little room to run. On bonds with shorter maturities, ratios collapsed to 50% and 88% on 1-year and 2-year bonds, respectively.
With lots of data moving markets, we will see if municipal valuations stay around these historical norms or if they continue to shift.
———————————————————————————————————————
CORPORATE MARKET OVERVIEW
Investment Grade Yield Summary:
Corporate Bond Spreads Versus Treasuries:
Corporate and high-yield bonds extended their rebound higher in May, trailing just the previously beaten down municipal bond sector in terms of performance. Both sectors were up over 2% in May after earning 5% in April.
The continued tightening of corporate spreads contributed to the strong performance along with the initiation of corporate bond purchases by the Federal Reserve. Using the 10-year corporate spread to Treasury as a benchmark, corporate spreads tightened 16 basis points in April. The spread sits at 162 basis points, below the 400 basis points it reached during the height of the uncertainty in March, but above the 108 basis points where it began this year. After much anticipation, the Federal Reserve began its program of purchasing corporate bonds and corporate bond ETFs on May 9. Through the end of the month, the Fed purchased $1.3 billion in ETFs according to State Street Global Advisors. Corporate fixed income ETFs received $9.3 billion overall during May, so the Fed was only a small piece of the inflows.
Investment grade issuance continues to surge and reached a milestone in the final week of May as year-to-date sales surpassed the $1 trillion mark. This pace was faster than any other year on record. The financial sector brought a heavy dose of volume with JP Morgan, Citigroup, Wells Fargo and HSBC among banks offering sizable new issuance in May. High yield issuance was not deterred either, as $40 billion bonds priced in May, the busiest month since 2017.
Investors’ risk-on appetite and the Fed backstop continues to provide support for the corporate debt market. However, we do not believe that this is a market without risk – there is plenty of uncertainty on the horizon. We can observe this uncertainty and stress in corporate bonds by looking at downgrade data of corporate credits.
According to a recent report published by S&P Global, potential downgrades of corporate issuers reached 1287 at the end of May, above the previous record of 1028 during the 2009 credit crunch. Potential downgrades are defined as issuers rated AAA to B- by S&P with either negative rating outlooks or ratings on credit watch with negative implications. This number ballooned and almost doubled from 649 in February. Ninety percent of these issuers are noted to be facing direct economic fallout from the pandemic. From a sector perspective, financial institutions, consumer products and utilities made up a significant percentage of these issuers on negative outlook.
Looking closer at this data also indicates that the gap between potential downgrades and potential upgrades widened sharply to reach a historically high level. This difference current sits at approximately 1100, over 3 times its long run average. Credit deterioration continues to be a real issue in the corporate bond market despite the rebound in prices and presence of the Fed. We expect the record issuance to continue as interest rates stay low but expect further downgrades and potentially defaults of big-name companies.