Fixed Income Market Summary – January 2019
US Treasuries – January brought continued strong performance for Treasuries despite a surge in equities during the month. The Federal Reserve abruptly shifted its tone, leading investors to believe that the Fed may pause their tightening cycle in 2019. Continued flattening of the Treasury curve is something to monitor as is projected Treasury issuance as it relates to the deficit.
Municipals – Municipals generated positive returns in January, continuing their steady performance over the last year. A projected surplus of cash from maturing bonds and income relative to issuance bodes well for the outlook in municipals. In addition, the rise of SMAs contributes to strength on the demand side. Unlike Treasuries, the municipal curve steepened, and the long end of the curve continues to provide value to investors.
Corporates – Corporate bonds exploded out of the gate in January, experiencing their best month since 2016. The bounce in the equity market and reduced headline risk worked in favor of the corporate market during the month. Corporate spreads to equivalent Treasuries tightened in January, after a substantial widening in 2018. Projections for weak Q1 2019 GDP, a potential ripple effect of the recently ended government shutdown, could be an issue for equity markets and corporate bonds.
——————————————————————————————————————–
BOND MARKET PERFORMANCE SNAPSHOT:
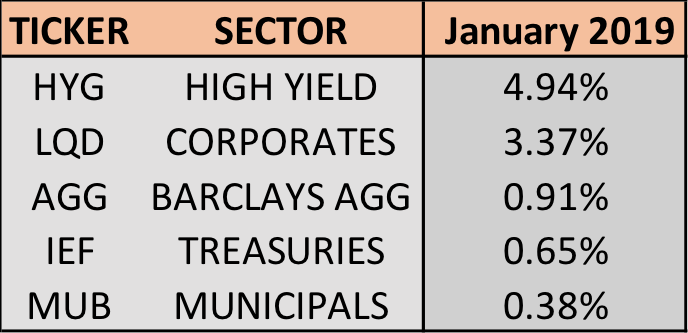
Bonds rose across the board alongside equities in January, continuing their strength from Q4 2018. Given their high correlation to equities, corporates and high yield were the biggest beneficiaries during the month. Investors flocked back to these bonds after a tumultuous end to 2018. Corporate bonds, as measured by LQD, experienced their best month since March 2016. Similarly, high yield bonds as measured by HYG soared almost 5%, their best month since September 2009. Investment grade bonds lagged in January. However, Treasuries and municipals still generated gains, each extending their string of positive months to 3.
TREASURY MARKET OVERVIEW:
TREASURY YIELD SUMMARY:
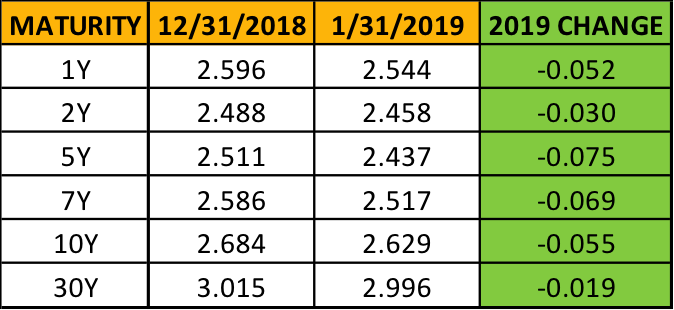
Treasuries also saw their 3rd straight month of gains as yields across all maturities dropped during January, continuing their momentum from December’s plunge, albeit at a slower pace. The 10-year treasury yield closed January 3rd at 2.55%, its lowest level in over a year, before bouncing around for the remainder of the month and eventually settling at 2.63%.
Bonds received a little boost at the end of the month after the Federal Reserve meeting and statement release represented a pivot in their policy stance compared to their December meeting and press conference. Chairman Powell announced a “wait-and-see” approach about future rate hikes, a 180 degree turn from December’s meeting where Powell indicated that the market volatility didn’t affect Fed policy. However, the Fed would not indicate that their tightening cycle has ended. From a balance-sheet perspective, Powell used the words “final stages” to describe the Fed’s balance-sheet unwinding, though the Fed did not confirm a desired target size for the balance sheet.
Given all these inputs, the current market expectation is for the Fed to pause in 2019 and not raise the Fed Funds rate at all. This is well below projections issued in Q4 that expected 1-2 hikes in 2019.
The Treasury yield curve continued its flattening pattern in January, with the 2-10 spread inching lower to 0.17%. This is the lowest monthly close for this spread since 2007. The 5-year yield finished January below the 1 and 2-year yield, as the government shutdown created near-term uncertainty and uneasiness in the Treasury market. In addition, on January 2nd, the US 5-year Treasury yield dropped below the Fed Funds target rate for the first time since March 2008, when the Fed cut rates 0.75%. The flattening Treasury curve continues to generate headlines in fixed income markets and will certainly be something investors monitor closely going forward.
Another longer-term data point we track is Treasury issuance – and how it relates to the deficit. Deficits as a portion of the US economy are projected to increase through 2022, driven largely by increased mandatory spending on Medicare and Social Security as demographic trends shift. In order to cover the deficit, Treasury issuance will need to increase accordingly. Where along the curve this issuance will occur remains to be seen. However, Bloomberg Intelligence projects that the weighted average maturity of Treasuries will fall slowly over the next several years. Currently the number sits at 68 months, with the 30-year average being 62 months. Short-term Treasury yields have risen enough during this tightening cycle where issuance of those bonds can be matched by investor demand. Pricing in the Treasury market is more often driven by demand, but supply issues are something to keep an eye on as the deficit is projected to swell.
——————————————————————————————————————–
MUNICIPAL MARKET OVERVIEW:
TAX-EXEMPT MUNICIPAL YIELD SUMMARY:
TAX-EXEMPT MUNICIPAL YIELDS AS A PERCENTAGE OF TREASURY:
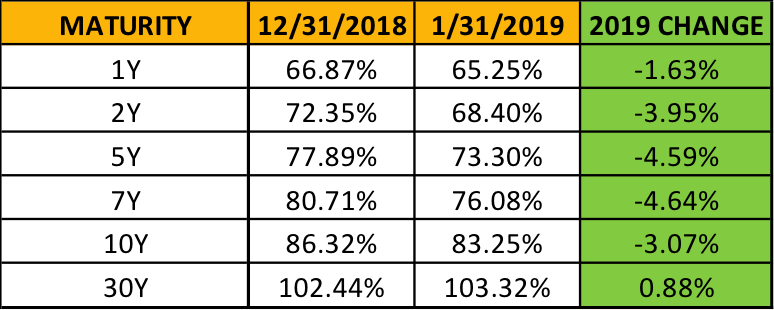
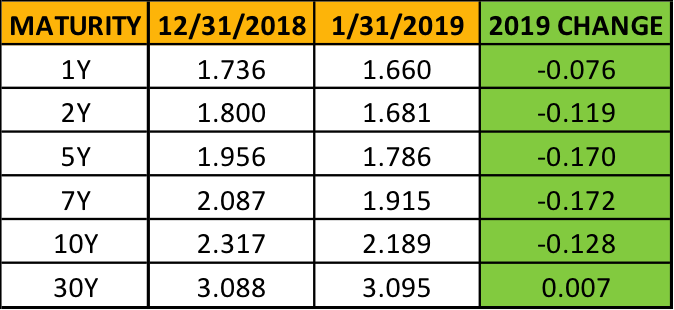
As mentioned, Munis had their 3rd straight month of gains in January, although they were the weakest performer among the major fixed income sectors. Municipal yields across the curve declined except for longer-term maturities, including the 30-year municipal as shown in the chart above. Similar to December 2018, the belly of the curve (5-10) years experienced the largest move down.
The projected imbalance in the municipal market between issuance and maturing securities/income payments indicates a favorable environment in 2019. For February, Citigroup projects the volume of new municipal sales in February to be $25.9 billion, less than the $30 billion that will mature or be called. Beyond the next month, $304.7 billion is expected to mature this year, with another $111.6 billion to be called, according to Bloomberg data projections and estimates. Thus, states and municipalities would have to issue about $420 billion in bonds to replace the ones being taken from investors. Over the last 10 years, this only happened in 2016 when $424 billion were sold as issuers took advantage of all-time lows in interest rates. For context, 2018 saw $321 billion in new issuance. In addition, municipal demand showed strength during January with investors adding $1.06 billion to municipal-bond mutual funds in the week ended January 30, the fourth straight week of inflows. All these market fundamentals set up well for the municipal market going forward.
On the valuation side, municipals with short-intermediate maturities continue to become increasingly expensive versus equivalent Treasuries. The ratio of 10-year municipals to 10-year Treasuries reached 80% in January, the lowest level since 2009. In addition, the municipal curve steepened during the month, as the 30-year municipal yield stayed stationary while the rest of the curve shifted down. The 2-10 spread is 32 basis points larger in the municipal market versus the Treasury market, and the 2-30 spread is 86 basis points larger. Clearly, value in municipals can be found on the longer end of the curve for investors willing to extend duration.
Another development supporting demand for municipals is the rise of separately managed accounts (SMAs). Investors have increasingly turned to SMAs for customization, which helps insulate the market when individuals pull cash from mutual funds. The ability to control duration and satisfy income targets at the client level is a major plus for advisors looking to assist risk averse investors in the space. According to Informa Financial, more than 150 municipal SMA products held about $162 billion in assets as of the end of Q3 2018, up 1 billion from a year prior. The space is projected to grow over the coming years as investors navigate the changing interest rate landscape.
——————————————————————————————————————–
CORPORATE MARKET OVERVIEW:
INVESTMENT GRADE CORPORATE YIELD SUMMARY:
CORPORATE BOND SPREADS VERSUS TREASURIES:
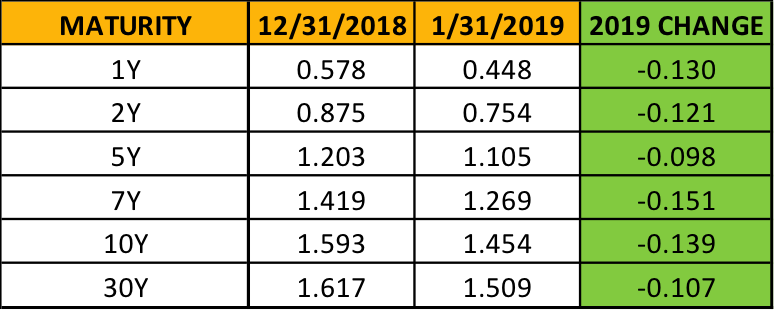
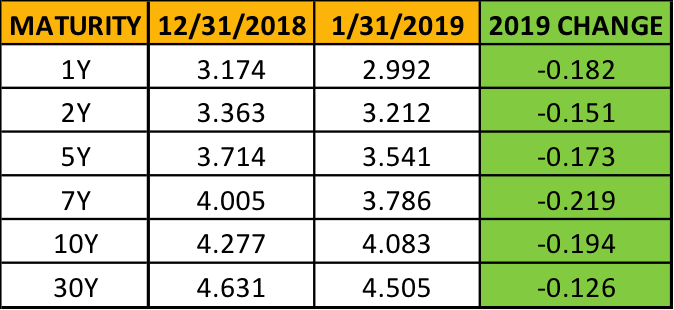
Corporate bonds experienced their best month in 3 years during January, returning over 3% as the best performer among investment grade credits. Corporate spreads versus equivalent Treasuries peaked on January 3rd at 1.63 for 10-year maturities, before declining sharply through the end of the month. High yield bonds also turned in a strong month, gaining almost 5%, more than overcoming a weak December.
A solid reversal in the equity market along with diminished headline risk in the space helped to support corporates during the month. Corporate and high yield bonds tend to have a higher correlation to equities, so it comes as no surprise that these sectors performed the best as global stocks rose sharply during January. In addition, oil prices rose 18% backing demand for high yield bonds. High yield bonds suffered historically during oil price declines, most recently in 2016, as they make up close to 15% of the index. General Electric and California Utility PG&E, two companies that made big headlines during Q4 2018, reported good news during the month, reducing the fear of contagion in the corporate market.
Also working in favor of the corporate market was the reduced issuance of investment grade bonds, specifically in financial companies, which represent close to 33% of the $5 trillion investment grade corporate market. According to Bloomberg, the largest US banks issued $12 billion of debt in January, about a third of sales at the same point last year. Debt sales are falling after these banks sold enough to meet Federal Reserve regulation and the increased cash flow resulting from last year’s tax cuts reduced borrowing needs. Banks are just one part of what is likely to be a big slowdown in new corporate issuance in 2019, as sales are down about 15% thus far in 2019 versus the same time last year across the entire corporate bond market. Projections from analysts at JPMorgan, Bloomberg and Nomura forecast that overall issuance in 2019 will fall by about 10%, which bodes well for corporate bonds going forward.
Potentially working against the corporate market are US GDP prospects in the coming quarters after the recently ended government shutdown. According to Bloomberg, economists estimate that the shutdown could cost the US close to 0.5% in GDP. As we pointed out before, there are several signs that the corporate market was already exhibiting late-cycle characteristics. A recent survey by Reuters indicates the odds of recession in 2019 remain close to 20%, so the alarm bells aren’t blaring. However, corporates tend to be the most economically sensitive sector and projections for earnings were already falling in Q4 2018 prior to the shutdown. We will have to wait until April’s GDP release to see if there are any lasting effects on the economy, but this certainly requires attention as it relates to the corporate bond market.
