
Flattening Yield Curve – A Sign of Things to Come?
Lately, the topic at the forefront of headlines and discussions in the investment industry is the flattening US treasury yield curve. This phenomenon occurred as short-term interest rates, largely influenced by the Federal Reserve’s monetary policy tightening, have risen significantly. On the flipside, long-term interest rates, which are largely influenced by growth and inflation expectations, haven’t budged due to generally tepid and inconsistent GDP, CPI and wage growth data.
While a flattening yield curve is not necessarily a problem, a yield curve inversion, defined by the 2-year treasury yielding more than the 10-year treasury for a sustained period, is a potentially more troubling development for the markets. The difference between the 2-year and the 10-year treasury is often referred to as the 2-10 spread. The chart below is from Tim Duy’s Fed Watch publication and uses information from the Federal Reserve’s Economic Data archives. It shows how this spread has changed over the last 30 years:
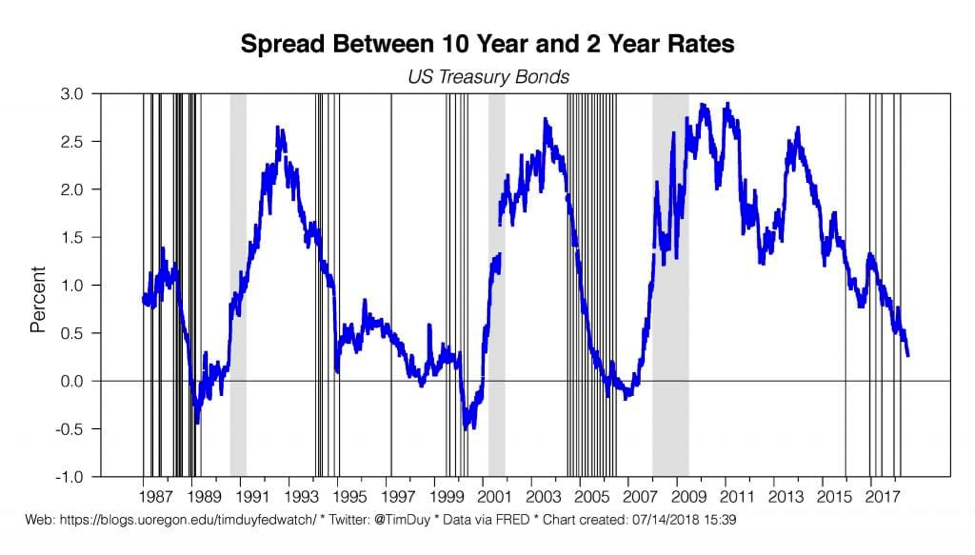
As you can see, the 2-10 spread has narrowed significantly over the last 5 years, and currently sits around 0.25%, the smallest spread since 2007 and well below its average of 1.7% over the last 10 years. This has prompted investors and economists to reignite the conversation about how, historically, inverted yield curves are leading indicators of recessions.
To be clear, typically an inverted yield curve by itself does not cause a recession. Rather, the curve inverts because the Fed drives short-term rates sharply higher by tightening monetary policy too aggressively. It’s this tightening that ultimately causes the recession and the Fed-triggered inversion ends up being a symptom of the bigger issue. Investors eventually get wise to the Fed’s tightening stance on monetary policy and push long-term rates down because they expect the Fed to ultimately reduce short-term rates in the future after a recession. The whole scenario plays out cyclically, but the Fed ends up being principally responsible for these shifts and their residual economic effects.
While an inverted yield curve has preceded each of the last 9 US economic recessions dating back to 1957, there are a couple important observations that must be acknowledged to provide additional context. Charlie Bilello of Pension Partners did some research on past inversions and concluded that in these 9 recessions, the lead time between inversion and recession was anywhere from 8 to 24 months, with an average of 14 months. Therefore, the alarm bell should not be immediately sounded if and when the yield curve inverts. Secondly, the average Fed funds rate during these inversions was 6.16%, whereas today’s Fed has set its target rate at 2%.
Of course, the Fed is a key player in all of this, as their decision to begin a cycle of monetary policy tightening (raising rates) is principally responsible for the flattening of the yield curve as mentioned above. Even with the current economy near full employment and a fiscal budget situation that promises to deliver massive new bond supply, the long end of the yield curve continues to hover and remain locked around 3% despite the Fed’s actions. We expect at least 1 more hike in 2018 and probably at least 2 more before an inversion might occur. Nonetheless, if and when the yield curve inverts, the Fed will have big decisions to make regarding future rate hikes.
More often than not, the Fed has historically continued to hike after a curve inversion. With growth and inflation showing finally signs of gaining a little momentum, we find it hard to believe that the Fed will change course from their plans of gradual hiking unless there are clear signs of an economic slowdown or financial crisis. Thus, we expect the Fed to keep hiking through a potential inversion. Furthermore, we expect the odds of a recession to increase if the Fed continues hiking after the inversion.
An inverted yield curve is used most reliably as a long-leading indicator that we may be reaching a peak in the business and economic cycles and in turn at greater risk of slipping into a recession. However, the exact moment of inversion is of no great significance to investors as proven by historical stock market performance after an inversion has occurred.
We view it as a warning signal to be more aware of the environment and cognizant of the Fed’s posture adjustment from a dovish (accommodative) stance to a tighter (hawkish) stance. Do they overplay their hand and choke off economic growth?
Only time will tell…