Adding Value With Active Bond Management
Active bond management does not mean “day-trading.” Nor does it mean buying and holding to maturity. Active bond management means being constantly apprised of where the markets are and seeking to take advantage of opportunities to add value. It is vigilance.
We seek to add value in both the purchase and the sale of a bond. On the purchase side, we look at the following factors:
- Credit
- Structure
- Security Selection
- Yield Curve Location
- Creativity/Inventiveness/Resourcefulness
On the sell side, our efforts are focused on managing where a client’s funds are invested across the yield curve. A consistently optimized portfolio is the goal because that is where alpha can be delivered.
We will first explore the purchase side of the equation, and the factors we take into consideration.
*********************************************************************************************************************************************************************************************************************************************************************************
The Purchase Side – Adding Value When Selecting Bonds
- Credit
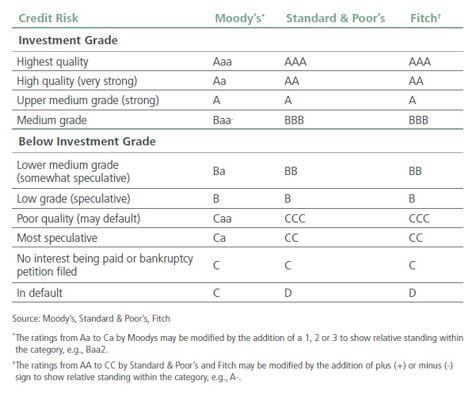
Credit is everything to us; return of principal is our first objective. A less than optimally invested portfolio could still provide a positive return but may not perform as well as planned. Below is a chart showing the Moody’s and Standard & Poor’s letter rating for each corresponding level of risk (creditworthiness).
We believe – and the data supports that belief – that there is no need to purchase a portfolio that exclusively includes the highest-rated (AAA) bonds. The math and data show that purchasing A-rated bonds does not materially impact the creditworthiness of the portfolio, yet ultimately provides a better yield.
According to data compiled by Moody’s, AAA municipals have never defaulted, and A-rated municipals have a default rate of just 0.07%. The chart below from Moody’s shows the default rates for each grade of bonds – both municipal and corporate bonds:
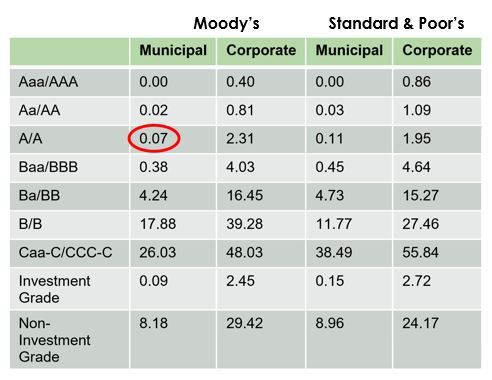
Given the data, we conclude that owning less than AAA-rated bonds does not materially increase the risks. However, a willingness to move down just two notches to A will add to the return.
How much added return? The chart below shows the spread – or additional yield (in bps) – an investor can generate by owning “A” rated municipals versus owning “AAA” municipals:
The difference fluctuates at various parts of the yield curve but overall averages about 0.40% per year across the 1 to 30-year spectrum. Said another way, while staying within high investment grade bonds (above BBB/Baa) and taking almost no additional credit risk, an investor can earn 0.40% in extra yield per year.
- Structure
Investing in bonds should be more than buying a ladder of basic “bullet” bonds, where the principal is repaid on one singular final maturity date. We believe strongly in the value of investing in bonds that contain a call feature, sinking fund feature, or some other interesting structure. In the instance of callable bonds, these can be redeemed (or paid off) by the issuing municipal authority at an agreed upon date prior to the bonds’ maturity date.
Why do we think this is the optimal way to invest in individual bonds? First, owners of these structured bonds are compensated with additional yield for taking on the “risk” (uncertainty) that a bond may or may not get called.
To illustrate the value of buying callable bonds, consider the 2 bonds below, both issued by Washington State:
| Washington State | Washington State | |
| Tax Treatment | Tax-Exempt | Tax-Exempt |
| Coupon | 5% | 5% |
| S&P Rating | AA+ | AA+ |
| Call Date | N/A | 2/1/2029 |
| Maturity | 2/1/2029 | 2/1/2039 |
| Yield to Call | N/A | 2.29% |
| Yield to Maturity | 1.72% | 3.38% |
Both bonds have the same coupon (5%), issuer (Washington State) and tax treatment (federally tax-free). The difference is that the bond on the left is a bullet bond that simply has a maturity in February 2029. In contrast, the bond on the right is callable in February 2029 and matures in February 2039.
Outcome: If the bond is called in 2029, we will have earned 2.29% per year. This is over half of a percent (.57% bps) better than the 1.72% earned on the bullet bond.
But what if that callable bond does not get called? In this case, the callable bond would continue until it matures in 2039.
The investor in the 2029 bullet must reinvest the proceeds of the maturing bond and buy a second 10-year bond that matures in 2039.
Since we know the holder of the callable bond will now earn 3.38% to the 2039 maturity, we can calculate that the holder of the original bullet bond must reinvest at 6.02% to be mathematically better off than the holder of the callable bond.
The graphic below helps summarize the decision between the two investments:
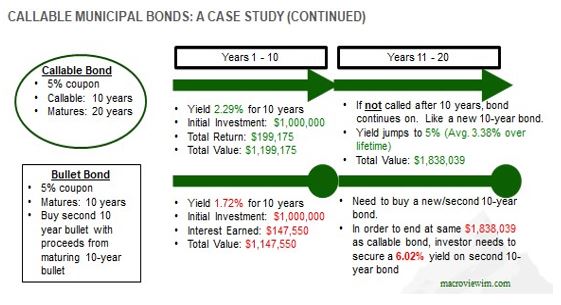
While many factors affect the decision to call a bond, the most relevant is level of interest rates in the market at the time a bond becomes callable. Since many municipal bonds are issued with 10year call date, municipalities will often use the 10-year US Treasury bond as a benchmark when making the determination to call their bonds. Remember, if the bond is called, the municipality will likely need to refinance the debt at current market interest rates.
Given the above thought process, are expecting interest rates to not exceed that 6.49% minimum reinvestment break-even rate before February 2029 (when the bullet bond investor must purchase the second 10-year bond). For context, the 10-year Treasury has not been at 5% since 2007 and has not reached 6% since 2000.
- Security Selection
Many municipal bond investors indiscriminately buy bonds that match the maturity, state, and credit requirements that they arbitrarily set for themselves. Frequently, these same investors also get spooked by headline risks such as Puerto Rico, Chicago, Ill and pension problems in various states. Where other investors avoid certain credits because of general headlines, we see opportunity to analysis and potentially add value.
To illustrate this, let’s use the Illinois State Tollway and University of California bonds below:
| Illinois St Tollway | University of CA | |
| Tax Treatment | Tax-Exempt | Tax-Exempt |
| Coupon | 5% | 5% |
| S&P Rating | AA- | AA- |
| Call Date | 1/1/2026 | 5/15/2026 |
| Maturity | 1/1/2040 | 5/15/2041 |
| Yield to Call | 2.30% | 1.86% |
| Yield to Maturity | 3.86% | 3.66% |
On the left column, we have an Illinois State Tollway bond, backed by highway revenue tolls. It is callable in 2026 and matures in 2040. This bond derives its payments from an essential service and thus carries an AA- credit rating. In the right column is a bond issued by the University of California with similar credit rating, coupon and call/maturity schedule. The key point to notice here is the different in the yield to call and yield to maturity.
The state of Illinois carries a BBB credit rating. To reiterate, the ability of the Illinois St tollway bond to repay has NOTHING TO DO WITH THE STATE OF ILLINOIS. However, because it carries an Illinois tag, this tollway bond will trade significantly cheaper as investors often shy away from bonds that are IL and/or mutual funds are not allowed to own them due to the state of Illinois’s overall fiscal problems. Bonds that derive their revenue from essential services (like tollways) often have the highest recovery rates, in most cases 100%. For example, the city of Detroit defaulted in 2013, the largest municipal default in the last 25 years, but owners of Detroit Water and Sewer bonds got repaid 100% of their principal.
All told, by owning the Illinois bond, an investor can earn an extra 0.45% per year for approximately 6.5 years if these bonds are called in 2026 and an extra 0.2% per year for approximately 21 years if these bonds go to maturity. For comparison, US Treasury yields for the same call/maturity dates as the Illinois St tollway bonds are 1.92% and
2.35%.
Value can be added with simple security selection and an in-depth understanding of certain parts of the market such as essential service revenue bonds.
- Yield Curve Location
When looking into any investment, one must consider the risk/reward. Obviously, you want to have a higher reward for a given amount of risk. In bond lingo, if you assume credits are equal, we interpret these two concepts as duration (risk) and yield (reward).
Duration is a bond’s sensitivity to movements in interest rates. The higher the duration, the greater the price change if interest rates move either up or down. All things equal (coupon, credit), bonds with longer time to maturity will have a longer duration. Yield is the net return an investor earns on a bond, when price movements and income are taken into account. Simply put, bond investors will want to earn more yield while keeping duration risk in check.
Another important concept concerning the yield curve is roll-down, which is best defined as how much additional yield an investor earns by extending maturities one year, versus the previous year. As an example, if the roll down in year 2 is currently 0.107%, this means that 2-year bonds yield 0.107% more than a 1-year bond. With that in mind, consider the chart below that shows the current yield for Arated municipals (blue) and the annual roll-down (orange) at various maturities.
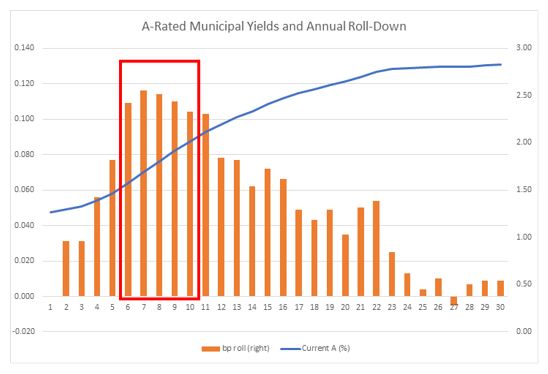
Given that the yield curve (blue line) is positively sloped, there are a couple observations to be made here. If we stick with the concept that duration is increased as time to maturity increases, we can see by the chart that investors moving out single years from years 6-10 on the muni curve are earning on average about 0.10% to 0.12% per year by extending the length of their bonds by 1 year, as shown by the orange bars. That number increases in the short-intermediate part of the curve, peaking in year 7. The roll-down then decreases back below 10 in year 12. Basically, the marginal return achieved through roll down for the additional length of time of lending money hits the sweet spot during that 6-10 year timeframe. The roll-down continues to decline after that window on the yield curve and actually reaches negative territory in year 27.
What does this mean in practice? Essentially, investors are not truly getting compensated on a risk/reward basis when you get past years 10-11. Therefore, we believe that investors should focus on incrementally increasing yield by focusing on the part of the curve that is steepest, and where the marginal return by extending maturities 1 year is greatest. We believe this area is highlighted in the red box above, from years 6-10.
Of course, the above chart just shows how yields are in the market place right now. It’s a snapshot in time. Therefore, prudent investors can generate value by consistently being on the steepest part of the curve, which requires constantly monitoring the yield curve and strategic investment placement.
- Creativity/Inventiveness/Resourcefulness
As with any asset class, value can be generated simply by understanding the market that an investor is trafficking in. Therefore, comparable risk/reward evaluations can be made and investors can weigh all options.
One example is the very underutilized segment of the market for taxable municipal bonds.
When most investors think of municipal bonds, they think of the exemption from federal taxes. However, there is a subset of the municipal bond market that is federally taxable. Not surprisingly, these bonds offer higher yields relative to other municipals, due to their unfavorable tax treatment.
Many investors do not know of the existence of the taxable municipal market, given that it makes up a relatively small portion of the municipal market. We think those investors are missing out on great opportunities to maximize return in a risk-efficient manner. To illustrate this example, consider the Osceola County, FL taxable municipal bond and the Home Depot corporate bonds below:
| Osceola County, FL | Home Depot – Corporate | |
| Tax Treatment | Taxable | Taxable |
| Coupon | 6.66% | 2.80% |
| S&P Rating | A | A |
| Maturity | 4/1/2027 | 9/14/2027 |
| Yield to Maturity | 3.03% | 2.58% |
Both bonds have similar ratings and maturities. However, as highlighted in orange, the taxable municipal bond (Osceola, FL) offers close to 0.5% in additional yield per year over the Home Depot bond. For comparative purposes, US Treasuries of equivalent maturities yield about 1.96%.
Further, there are also a couple important credit considerations when looking at these two bonds. First, municipals are generally better credits versus corporates, with significantly lower default rates. Simply put, they are not subject to changes in individual business cycles and often have at least limited taxing authority in some capacity. In fact, BBB municipals, the lowest of the investment grade municipals, historically default LESS than AAA corporates, as shown in the chart below:
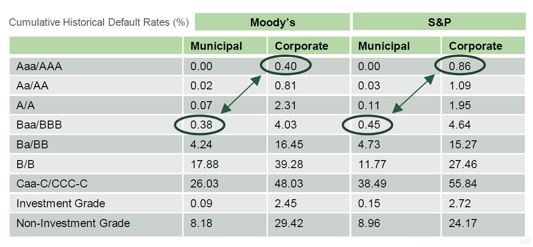
By choosing to invest in the Osceola bond, an investor is earning more return with less risk. But this is only because the investor that owns the Osceola bond is familiar with a segment of the market that is not as well-known and has done the additional research on the credit.
We often are asked about AAA corporate bonds. Looking again at this table, A-rated muni bonds are a better credit risk (default less) than AAA corporate bonds. Accordingly, we generally choose taxable municipals over corporate bonds.
The Sale Side – Yield Curve management
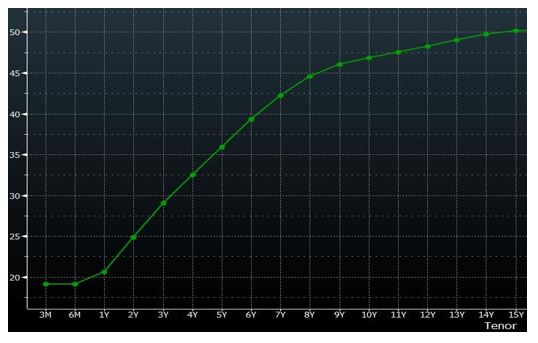
If the yield curve is positively sloped, opportunities exist to achieve a return that exceeds the stated yield of the bond at purchase. To illustrate this example, consider the yield curve below:
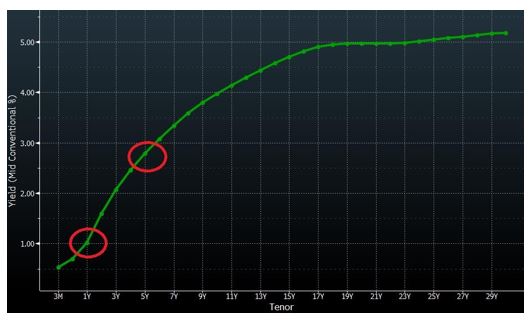
Based on this, a 5-year bond yields about 3% annually at purchase, and after 4 years this bond yields only 1%. Given these conditions, the concept of roll-down return can be used to achieve additional return when compared to a passive strategy.
The math:
- A 5-year bond yielding 3% will make approximately 15% over the 5-year life of the bond (3% per year X 5 years)
- A 1-year bond yielding 1% will make approximately 1% in 1 year
- If in the final year of owning the bond, the bond is only making 1%, that means in the other 4 years the bond must make 14%, or an average return of 3.5% (14/4 = 3.5%)
By selling the bond prior when the bond has only one year to maturity, the original 3% yielding bond generates an annual return of 3.5%.
In the same way that we discussed above about monitoring the yield curve and choosing where to buy bonds, choosing when to sell based on the shape of the yield curve can also add value. As a reminder, these types of opportunities for selling are more prevalent when the yield curve is positively sloped. Thus, in the current market environment with a flattening yield curve, adding significant value by rolling up the curve becomes more challenging.